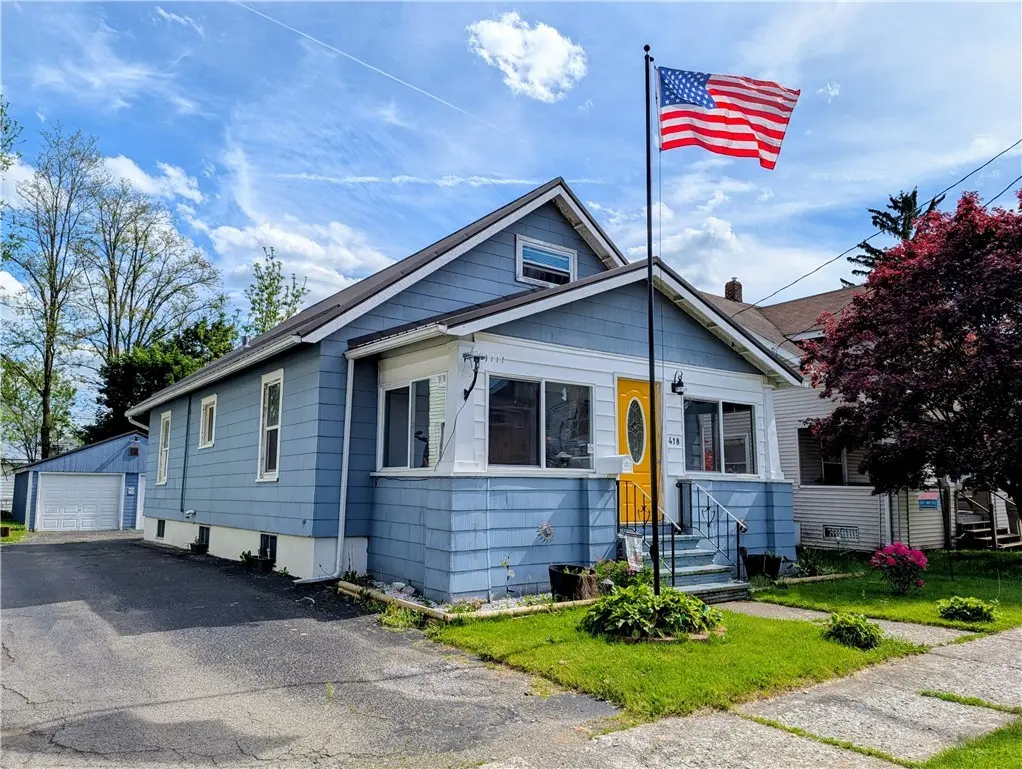
418 Phoenix Ave
Southport, NY 14904
$129,500C-
2 bd · 1.0 ba ·
1,360 sqft ·
Built 1930
· SingleFamily
· Active
· 24 DOM
Cashflow @ list (25.0% down · 7.5%)
Estimated rent
$1,513/mo
Mortgage (P&I)
−$679
Tax + insurance
−$232
HOA
−$0
Vac / Maint / Mgmt
−$318
Net cashflow
$284/mo
Annual
$3,406/yr
Cap rate
8.92%
Cash-on-cash
9.39%
DSCR
1.42
1% rule
1.17%
Cash to close
$36,260
Investor read
- This is a 2-bed/1.0-bath single-family listed at $130k.
- At list price, monthly cash flow is $284 ($3k/yr) — positive.
- The deal already cash-flows at list — no discount required.
- Meets the 1% rule at list price ($2k rent vs $130k).
- It's been on market 24 days — a 2% lower offer ($128k) is reasonable based on typical stale-listing flexibility.
- Recommended offer: $128k (1.5% below list) — sets the bar for market timing.
- Local home prices are declining (-3.0%/yr); year-one equity from $895 of loan paydown is wiped out by about $4k of value loss. Plan a longer hold.
- Location reads 65/100 on livability (#690 in NY) — a middle-class / working-renter tenant base. Strengths: cost of living A+, housing A; Watch: schools D+, employment D, health & safety D.
- Elmira City School District (urban): math 23% / reading 35% proficiency, ranked #580 of 590 in NY (top 98%) — low school quality limits family demand, transient renter base, plan for 1-2y turnover.
- Watch-outs: built in 1930 — expect roof / HVAC / electrical / plumbing capex.
- Market conditions: 101 active listings in the ZIP; 5 comparable units currently listed for rent nearby; rentals lingering (median 44d on market — plan ~5-8 weeks vacancy on turnover, expect pricing pressure); 100% of comp listings sitting > 30 days — soft ceiling on asking rent; 91 units permitted in Chemung County in 2024 (63 in 5+ unit buildings).
- Chemung County population projected at -17% by 2050 — secular population decline; favor cash flow + early exit over multi-decade hold.
- 3 sale attempts since 23y ago; this cycle's ask has dropped $10k (7%) from the opening price — seller is motivated, your offer sets the floor, not the list.
- Current owner paid $92k; 41% above their basis — modest negotiation headroom, anchor on the comps not their cost.
- Cap rate 8.9% vs local median 6.5% in Southport — top-decile yield for the area; either an underpriced asset or a hidden risk that comps aren't pricing in. Stress-test before assuming the spread holds.
Questions for listing agent
- Built in 1930 — when were the roof, HVAC, electrical panel, plumbing, and water heater last replaced?
- Is there a deadline driving the sale (1031 exchange, divorce, estate, relocation)? That informs how much negotiation room exists.
- Schools are D-rated, which usually means shorter tenancies and higher turnover. Who's the typical renter profile here, and what's been the actual vacancy rate?
- Crime grade is D in this area — have there been break-ins, vandalism, or insurance claims at this property in the last 3 years? What carrier currently insures it and at what premium?
- What's the average days-on-market for RENTAL listings here right now (not sales)? A rising rental-DOM trend means longer vacancies and softer asking-rent achievability than the comps imply.
- What's the recent tenant-quality profile in this submarket — average credit score on applications, eviction rate, late-payment / NSF rate, and stable-employment percentage? A property-management company in the area should have these aggregated.
- How much new for-sale + rental construction is in the pipeline within 1–3 miles? Heavy new supply typically softens prices + rents 12–24 months out; constrained supply supports both.
CashFlowRE · CFR-ECBC0S5DFDP4WB
· Data 1 day ago
cashflowre.app · 2026-05-29