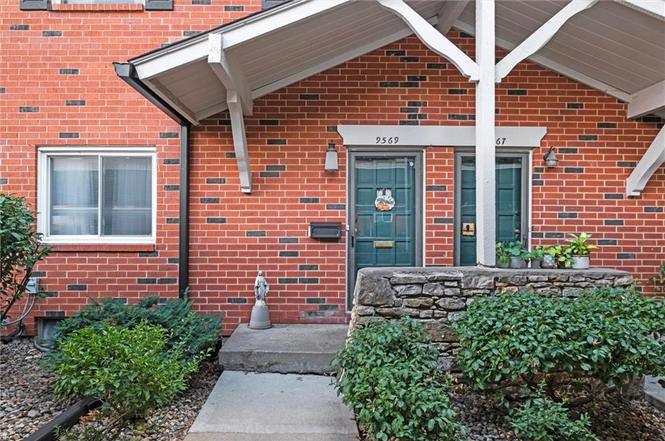
9569 Outlook Dr
Overland Park, KS 66207
$219,950D+
3 bd · 2.5 ba ·
1,744 sqft ·
Built 1966
· Townhouse
· Pending
· 49 DOM
Cashflow @ list (25.0% down · 7.5%)
Estimated rent
$2,391/mo
Mortgage (P&I)
−$1,153
Tax + insurance
−$244
HOA
−$585
Vac / Maint / Mgmt
−$502
Net cashflow
$-94/mo
Annual
$-1,123/yr
Cap rate
5.78%
Cash-on-cash
-1.82%
DSCR
0.92
1% rule
1.09%
Cash to close
$61,586
Investor read
- This is a 3-bed/2.5-bath townhouse listed at $220k.
- At list price, monthly cash flow is $-94 ($-1k/yr) — negative.
- To cash-flow at today's rent, offer at most $203k (7.5% below list).
- Meets the 1% rule at list price ($2k rent vs $220k).
- It's been on market 49 days — a 3% lower offer ($213k) is reasonable based on typical stale-listing flexibility.
- Recommended offer: $203k (7.5% below list) — sets the bar for cash-flow.
- Local home prices are declining (-3.0%/yr); year-one equity from $2k of loan paydown is wiped out by about $7k of value loss. Plan a longer hold.
- Location reads 80/100 on livability (#16 in KS, #1,851 nationally) — a professional / high-income tenant draw. Strengths: employment A+, housing A+, crime B; Watch: health & safety C-, commute D+.
- Shawnee Mission Pub Schools (suburban): math 38% / reading 46% proficiency, ranked #22 of 169 in KS (top 13%) — families likely to look elsewhere, expect single-tenant / working-renter base with shorter leases.
- Zoned schools: John Diemer Elem (math 56% / reading 62%, grade B-, #81 of 684 statewide, top 12%, 401 students, 35% FRL).
- Zoned-school proficiency averages 59% at this address vs 42% district-wide (+17 pts) — the actual schools serving this property are materially stronger than the Shawnee Mission Pub Schools average implies; a family-tenant draw the district grade alone would hide.
- Watch-outs: HOA is 24% of rent.
- Market conditions: Rents rising fast (+4.7%/yr); 61 active listings in the ZIP; 11 comparable units currently listed for rent nearby; rentals at typical pace (median 15d on market — plan ~3-4 weeks tenant-placement turnaround); high-income renter base; 2,969 units permitted in Johnson County in 2024 (1,066 in 5+ unit buildings).
- Johnson County population projected at +27% by 2050 — long-run rental-demand tailwind backs the buy-and-hold thesis.
- 6 sale attempts since 19y ago with the ask held roughly flat each time — persistent listings suggest the price (not the market) is what's stuck; bring a comps-based counter.
- Cap rate 5.8% vs local median 3.9% in Overland Park — top-decile yield for the area; either an underpriced asset or a hidden risk that comps aren't pricing in. Stress-test before assuming the spread holds.
Questions for listing agent
- What do current leases actually rent for vs. the listed asking? Can we see a recent rent roll and the last 12 months of T-12 income?
- It's been on market 49 days. Have you received any prior offers? Is the seller open to a 8% concession, seller financing, or rate buy-down credit?
- Built in 1966 — when were the roof, HVAC, electrical panel, plumbing, and water heater last replaced?
- What does the HOA fee cover, when was the last increase, and are there any pending special assessments or reserve-fund shortfalls?
- Is there a deadline driving the sale (1031 exchange, divorce, estate, relocation)? That informs how much negotiation room exists.
- Schools are B-rated — typically a magnet for longer-tenancy family renters. What's the average tenant stay here, and is there a school-zone premium baked into asking?
- The area grade is low — what's the realistic commute time and amenity access for the typical tenant pool here? Any planned neighborhood developments (good or bad) we should know about?
- What's the average days-on-market for RENTAL listings here right now (not sales)? A rising rental-DOM trend means longer vacancies and softer asking-rent achievability than the comps imply.
CashFlowRE · CFR-ECFSSD69X5XEQC
· Data 3 weeks ago
cashflowre.app · 2026-05-29