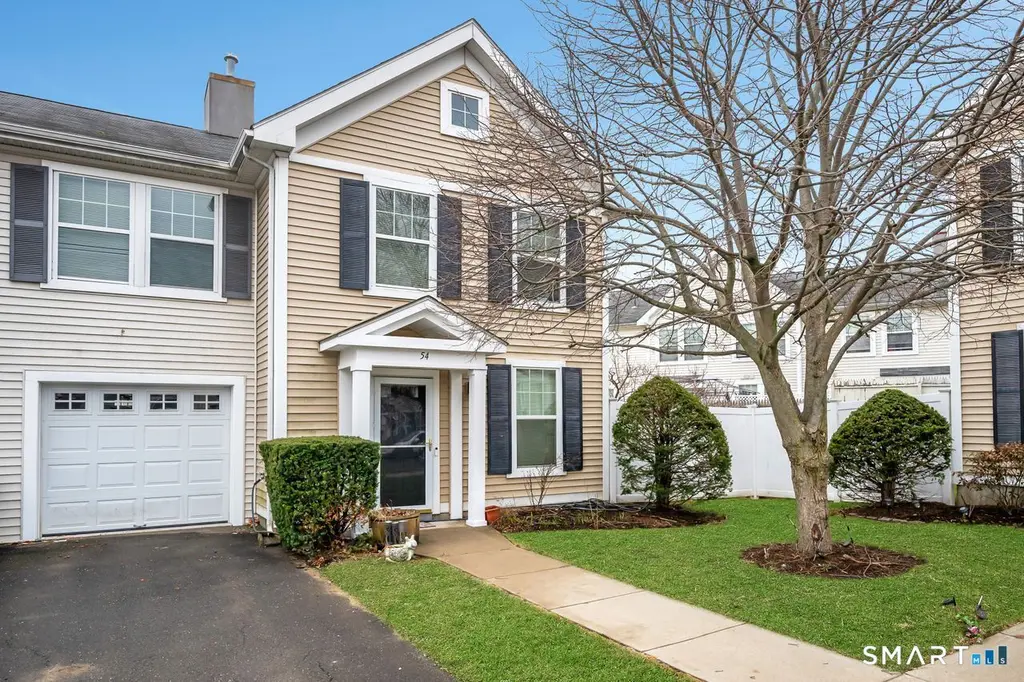
54 Young Dixon Way #54
Stamford, CT 06902
$366,000C
3 bd · 2.5 ba ·
1,380 sqft ·
Built 2006
· SingleFamily
· Under Contract
· 26 DOM
Cashflow @ list (25.0% down · 7.5%)
Estimated rent
$3,937/mo
Mortgage (P&I)
−$1,919
Tax + insurance
−$610
HOA
−$225
Vac / Maint / Mgmt
−$827
Net cashflow
$356/mo
Annual
$4,269/yr
Cap rate
7.46%
Cash-on-cash
4.17%
DSCR
1.19
1% rule
1.08%
Cash to close
$102,480
Investor read
- This is a 3-bed/2.5-bath single-family listed at $366k. Condition is rated good.
- At list price, monthly cash flow is $356 ($4k/yr) — positive.
- The deal already cash-flows at list — no discount required.
- Meets the 1% rule at list price ($4k rent vs $366k).
- It's been on market 26 days — a 2% lower offer ($361k) is reasonable based on typical stale-listing flexibility.
- Recommended offer: $361k (1.5% below list) — sets the bar for market timing.
- Local home prices are declining (-3.0%/yr); year-one equity from $3k of loan paydown is wiped out by about $11k of value loss. Plan a longer hold.
- Location reads 70/100 on livability (#98 in CT) — a middle-class / working-renter tenant base. Strengths: employment A+, health & safety A+, crime A-; Watch: amenities F, commute F, cost of living F.
- Stamford School District (urban): math 32% / reading 43% proficiency, ranked #103 of 153 in CT (top 67%) — families likely to look elsewhere, expect single-tenant / working-renter base with shorter leases.
- Market conditions: Rents rising (+1.9%/yr); 188 active listings in the ZIP; 40 comparable units currently listed for rent nearby; rentals at typical pace (median 15d on market — plan ~3-4 weeks tenant-placement turnaround); solid renter incomes; 1,151 units permitted in Western Connecticut Planning Region in 2024 (714 in 5+ unit buildings).
- 2 sale attempts with the ask held roughly flat each time — persistent listings suggest the price (not the market) is what's stuck; bring a comps-based counter.
- Climate carrying-cost: major wind risk, 69% chance of damaging wind over 30y; extreme-heat days projected 7→16/yr by 2055 (HVAC capex compounding) — expect insurance premiums to compound above CPI over the hold.
- Cap rate 7.5% vs local median 3.0% in Stamford — top-decile yield for the area; either an underpriced asset or a hidden risk that comps aren't pricing in. Stress-test before assuming the spread holds.
- At $3,937/mo this rent would consume 50% of the median local household income ($95k/yr) (locally 4139% of renters already pay >50% of income on rent) — very limited rent-growth headroom before tenants either downsize or default.
Questions for listing agent
- What does the HOA fee cover, when was the last increase, and are there any pending special assessments or reserve-fund shortfalls?
- Is there a deadline driving the sale (1031 exchange, divorce, estate, relocation)? That informs how much negotiation room exists.
- Schools are B-rated — typically a magnet for longer-tenancy family renters. What's the average tenant stay here, and is there a school-zone premium baked into asking?
- What's the average days-on-market for RENTAL listings here right now (not sales)? A rising rental-DOM trend means longer vacancies and softer asking-rent achievability than the comps imply.
- What's the recent tenant-quality profile in this submarket — average credit score on applications, eviction rate, late-payment / NSF rate, and stable-employment percentage? A property-management company in the area should have these aggregated.
- How much new for-sale + rental construction is in the pipeline within 1–3 miles? Heavy new supply typically softens prices + rents 12–24 months out; constrained supply supports both.
CashFlowRE · CFR-ECGXKY8MH2PXQD
· Data 3 weeks ago
cashflowre.app · 2026-05-29