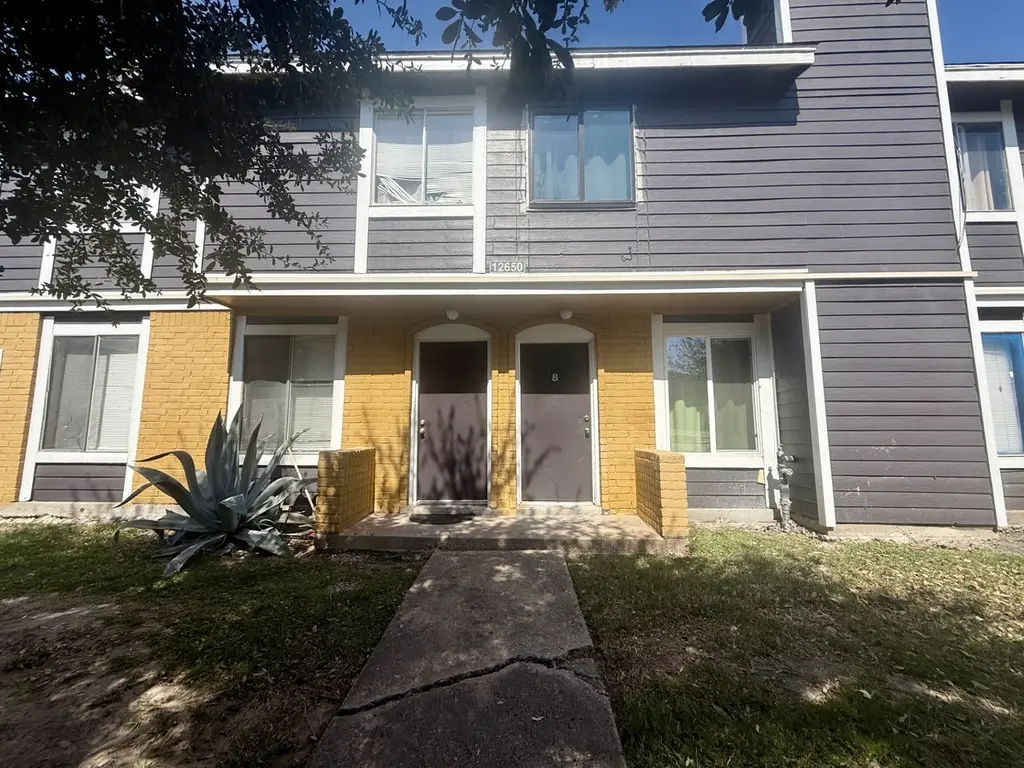
12650 Ashford Meadow Dr #4
Houston, TX 77082
$339,000C-
8 bd · 8.0 ba ·
4,272 sqft ·
Built 1981
· MultiFamily
· Active
· 114 DOM
Cashflow @ list (25.0% down · 7.5%)
Estimated rent
$3,895/mo
Mortgage (P&I)
−$1,778
Tax + insurance
−$1,287
HOA
−$360
Vac / Maint / Mgmt
−$818
Net cashflow
$-347/mo
Annual
$-4,168/yr
Cap rate
6.57%
Cash-on-cash
1.00%
DSCR
1.04
1% rule
1.15%
Cash to close
$94,920
Investor read
- This is a 2 × 4-bed/?-bath units multifamily listed at $339k.
- At list price, monthly cash flow is $-347 ($-4k/yr) — negative. Per door: $-174/mo.
- To cash-flow at today's rent, offer at most $278k (18.1% below list).
- Meets the 1% rule at list price ($4k rent vs $339k).
- It's been on market 114 days — a 9% lower offer ($308k) is reasonable based on typical stale-listing flexibility.
- Recommended offer: $278k (18.1% below list) — sets the bar for cash-flow.
- Local home prices are declining (-2.2%/yr); year-one equity from $2k of loan paydown is wiped out by about $7k of value loss. Plan a longer hold.
- Location reads 74/100 on livability (#184 in TX, #4,771 nationally) — a middle-class / working-renter tenant base. Strengths: amenities A+, cost of living A+, housing A+; Watch: crime F.
- Alief ISD (urban): math 23% / reading 28% proficiency, ranked #717 of 826 in TX (top 87%) — low school quality limits family demand, transient renter base, plan for 1-2y turnover; 74% free/reduced lunch — lower-income household profile, screen leases tightly.
- Zoned schools: Heflin El (math 16% / reading 27%, grade F, #3,470 of 4,322 statewide, top 81%, 601 students, 89% FRL); O'Donnell Middle (math 32% / reading 33%, grade F, #947 of 1,662 statewide, top 58%, 1,230 students, 89% FRL); Alief Isd J J A E P (13 students, 77% FRL).
- Watch-outs: property tax is 2.5% of price; flood insurance adds $427/mo.
- Market conditions: Rents soft (-1.6%/yr); 302 active listings in the ZIP; 29,883 units permitted in Harris County in 2024 (8,621 in 5+ unit buildings).
- Harris County population projected at +47% by 2050 — long-run rental-demand tailwind backs the buy-and-hold thesis.
- 6 sale attempts since 7y ago with the ask held roughly flat each time — persistent listings suggest the price (not the market) is what's stuck; bring a comps-based counter.
- Climate carrying-cost: in FEMA flood zone AE (mandatory federal flood insurance); severe wind risk, 99% chance of damaging wind over 30y; extreme-heat days projected 7→24/yr by 2055 (HVAC capex compounding) — expect insurance premiums to compound above CPI over the hold.
- Cap rate 6.6% vs local median 3.2% in Houston — top-decile yield for the area; either an underpriced asset or a hidden risk that comps aren't pricing in. Stress-test before assuming the spread holds.
- At $3,895/mo this rent would consume 75% of the median local household income ($62k/yr) (locally 3722% of renters already pay >50% of income on rent) — very limited rent-growth headroom before tenants either downsize or default.
Questions for listing agent
- What do current leases actually rent for vs. the listed asking? Can we see a recent rent roll and the last 12 months of T-12 income?
- It's been on market 114 days. Have you received any prior offers? Is the seller open to a 18% concession, seller financing, or rate buy-down credit?
- Can we see the unit-by-unit rent roll, current vacancy, and any below-market leases? What's the average tenancy length?
- What capital expenditures (roof, boiler, parking lot, exteriors) have been made in the last 5 years, and what's planned in the next 2?
- Property tax is high relative to price — has the assessment been appealed recently, and will the sale trigger a re-assessment?
- What's the actual annual flood-insurance premium (NFIP or private), and is the property in a SFHA with mandatory coverage?
- What does the HOA fee cover, when was the last increase, and are there any pending special assessments or reserve-fund shortfalls?
- Why hasn't it sold? Are there any deal-killer items the seller is aware of (foundation, flood, title, zoning, code violations)?
CashFlowRE · CFR-EE378KBFFF0PG1
· Data 1 day ago
cashflowre.app · 2026-05-29