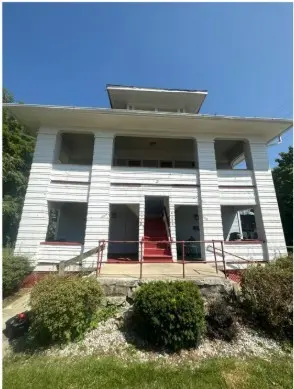
204 W Johnny Lytle Ave
Springfield, OH 45506
$144,900B-
16 bd · 16.0 ba ·
5,222 sqft ·
Built 1919
· MultiFamily
· Active
· 25 DOM
Cashflow @ list (25.0% down · 7.5%)
Estimated rent
$4,056/mo
Mortgage (P&I)
−$760
Tax + insurance
−$449
HOA
−$0
Vac / Maint / Mgmt
−$852
Net cashflow
$1,995/mo
Annual
$23,939/yr
Cap rate
23.36%
Cash-on-cash
60.97%
DSCR
3.71
1% rule
2.80%
Cash to close
$40,572
Investor read
- This is a 4 × 1-bed/1-bath units multifamily listed at $145k.
- At list price, monthly cash flow is $2k ($24k/yr) — positive. Per door: $499/mo.
- The deal already cash-flows at list — no discount required.
- Meets the 1% rule at list price ($4k rent vs $145k).
- It's been on market 25 days — a 2% lower offer ($143k) is reasonable based on typical stale-listing flexibility.
- Recommended offer: $143k (1.5% below list) — sets the bar for market timing.
- Local home prices are declining (-3.0%/yr); year-one equity from $1k of loan paydown is wiped out by about $4k of value loss. Plan a longer hold.
- Location reads 56/100 on livability (#1,108 in OH) — a working-class tenant base; expect higher turnover. Strengths: cost of living A+, housing A+; Watch: crime F, amenities F, commute F.
- Springfield City School District (urban): math 20% / reading 27% proficiency, ranked #616 of 656 in OH (top 94%) — low school quality limits family demand, transient renter base, plan for 1-2y turnover; 75% free/reduced lunch — lower-income household profile, screen leases tightly.
- Watch-outs: property tax is 2.7% of price; flood insurance adds $66/mo; built in 1919 — expect roof / HVAC / electrical / plumbing capex.
- Market conditions: 45 active listings in the ZIP; lower-income renter base — watch delinquency; 232 units permitted in Clark County in 2024 (116 in 5+ unit buildings).
- Clark County population projected at -16% by 2050 — secular population decline; favor cash flow + early exit over multi-decade hold.
- 3 sale attempts since 2y ago with the ask held roughly flat each time — persistent listings suggest the price (not the market) is what's stuck; bring a comps-based counter.
- Current owner paid $57k; list at $145k implies a 154% gain — meaningful room to come down on a strong offer.
- At projected returns (-3.0% appreciation + 3.0% rent growth), your $41k cash investment doubles in ~2 years — after that, you're playing with house money.
- Climate carrying-cost: major flood risk — expect insurance premiums to compound above CPI over the hold.
- Cap rate 23.4% vs local median 4.8% in Springfield — top-decile yield for the area; either an underpriced asset or a hidden risk that comps aren't pricing in. Stress-test before assuming the spread holds.
- At $4,056/mo this rent would consume 116% of the median local household income ($42k/yr) (locally 684% of renters already pay >50% of income on rent) — very limited rent-growth headroom before tenants either downsize or default.
Questions for listing agent
- Can we see the unit-by-unit rent roll, current vacancy, and any below-market leases? What's the average tenancy length?
- What capital expenditures (roof, boiler, parking lot, exteriors) have been made in the last 5 years, and what's planned in the next 2?
- Built in 1919 — when were the roof, HVAC, electrical panel, plumbing, and water heater last replaced?
- Property tax is high relative to price — has the assessment been appealed recently, and will the sale trigger a re-assessment?
- What's the actual annual flood-insurance premium (NFIP or private), and is the property in a SFHA with mandatory coverage?
- Is there a deadline driving the sale (1031 exchange, divorce, estate, relocation)? That informs how much negotiation room exists.
- Crime grade is F in this area — have there been break-ins, vandalism, or insurance claims at this property in the last 3 years? What carrier currently insures it and at what premium?
- What's the average days-on-market for RENTAL listings here right now (not sales)? A rising rental-DOM trend means longer vacancies and softer asking-rent achievability than the comps imply.
CashFlowRE · CFR-EG284CEPR6BVVJ
· Data 1 day ago
cashflowre.app · 2026-05-29