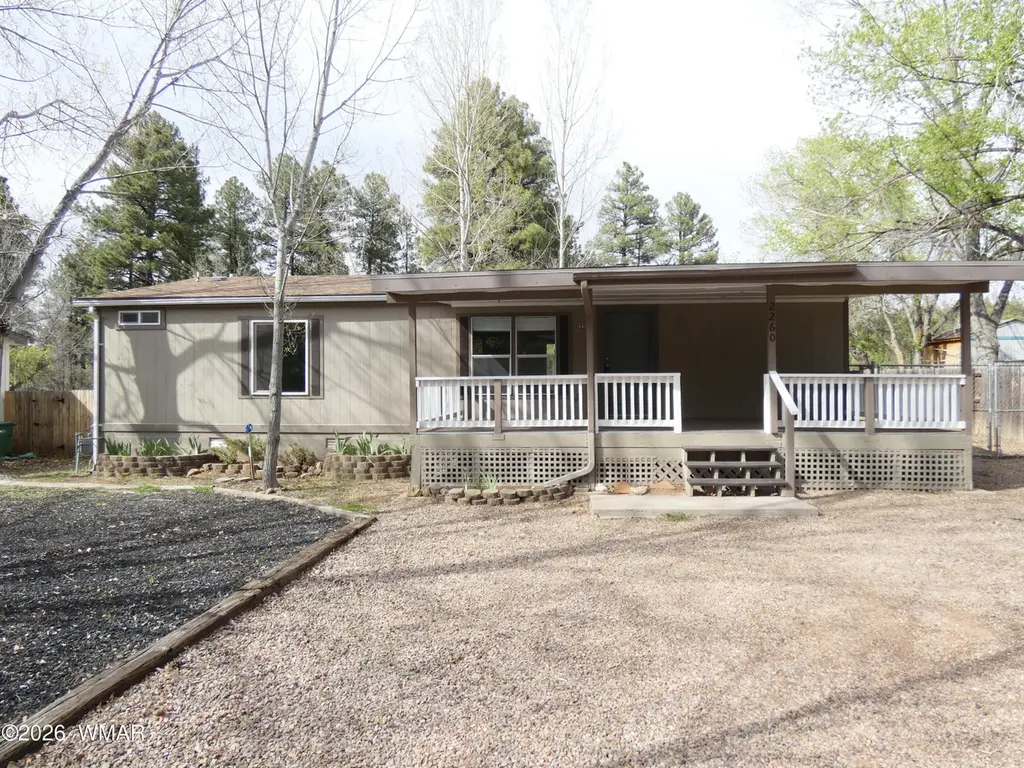
2260 W Park Valley Rd
Show Low, AZ 85901
$299,000C+
3 bd · 2.0 ba ·
1,512 sqft ·
Built 1999
· Manufactured
· Active
· 38 DOM
Cashflow @ list (25.0% down · 7.5%)
Estimated rent
$3,172/mo
Mortgage (P&I)
−$1,568
Tax + insurance
−$612
HOA
−$0
Vac / Maint / Mgmt
−$666
Net cashflow
$326/mo
Annual
$3,907/yr
Cap rate
9.31%
Cash-on-cash
10.78%
DSCR
1.48
1% rule
1.06%
Cash to close
$83,720
Investor read
- This is a 3-bed/2.0-bath manufactured listed at $299k.
- At list price, monthly cash flow is $326 ($4k/yr) — positive.
- The deal already cash-flows at list — no discount required.
- Meets the 1% rule at list price ($3k rent vs $299k).
- It's been on market 38 days — a 3% lower offer ($290k) is reasonable based on typical stale-listing flexibility.
- Recommended offer: $290k (3.0% below list) — sets the bar for market timing.
- Local home prices are declining (-3.0%/yr); year-one equity from $2k of loan paydown is wiped out by about $9k of value loss. Plan a longer hold.
- Location reads 65/100 on livability (#90 in AZ) — a middle-class / working-renter tenant base. Strengths: cost of living A+, housing A+; Watch: employment D, crime F, amenities F.
- Show Low Unified District (4393) (rural): math 32% / reading 39% proficiency, ranked #89 of 249 in AZ (top 36%) — families likely to look elsewhere, expect single-tenant / working-renter base with shorter leases.
- Watch-outs: flood insurance adds $427/mo.
- Market conditions: 891 active listings in the ZIP; 5 comparable units currently listed for rent nearby; rentals leasing fast (median 14d on market — plan ~1-2 weeks tenant-placement turnaround); 40% of comp listings sitting > 30 days — soft ceiling on asking rent; 485 units permitted in Navajo County in 2024 (11 in 5+ unit buildings).
- Navajo County population projected at -16% by 2050 — secular population decline; favor cash flow + early exit over multi-decade hold.
- 2 sale attempts with the ask held roughly flat each time — persistent listings suggest the price (not the market) is what's stuck; bring a comps-based counter.
- Current owner paid $57k; list at $299k implies a 427% gain — meaningful room to come down on a strong offer.
- Climate carrying-cost: in FEMA flood zone AE (mandatory federal flood insurance); major wildfire risk — expect insurance premiums to compound above CPI over the hold.
- Cap rate 9.3% vs local median 3.3% in Show Low — top-decile yield for the area; either an underpriced asset or a hidden risk that comps aren't pricing in. Stress-test before assuming the spread holds.
Questions for listing agent
- It's been on market 38 days. Have you received any prior offers? Is the seller open to a 3% concession, seller financing, or rate buy-down credit?
- What's the actual annual flood-insurance premium (NFIP or private), and is the property in a SFHA with mandatory coverage?
- Is there a deadline driving the sale (1031 exchange, divorce, estate, relocation)? That informs how much negotiation room exists.
- Schools are B-rated — typically a magnet for longer-tenancy family renters. What's the average tenant stay here, and is there a school-zone premium baked into asking?
- Crime grade is F in this area — have there been break-ins, vandalism, or insurance claims at this property in the last 3 years? What carrier currently insures it and at what premium?
- What's the average days-on-market for RENTAL listings here right now (not sales)? A rising rental-DOM trend means longer vacancies and softer asking-rent achievability than the comps imply.
- What's the recent tenant-quality profile in this submarket — average credit score on applications, eviction rate, late-payment / NSF rate, and stable-employment percentage? A property-management company in the area should have these aggregated.
- How much new for-sale + rental construction is in the pipeline within 1–3 miles? Heavy new supply typically softens prices + rents 12–24 months out; constrained supply supports both.
CashFlowRE · CFR-EGR8F88MM7R9MN
· Data 1 day ago
cashflowre.app · 2026-05-29