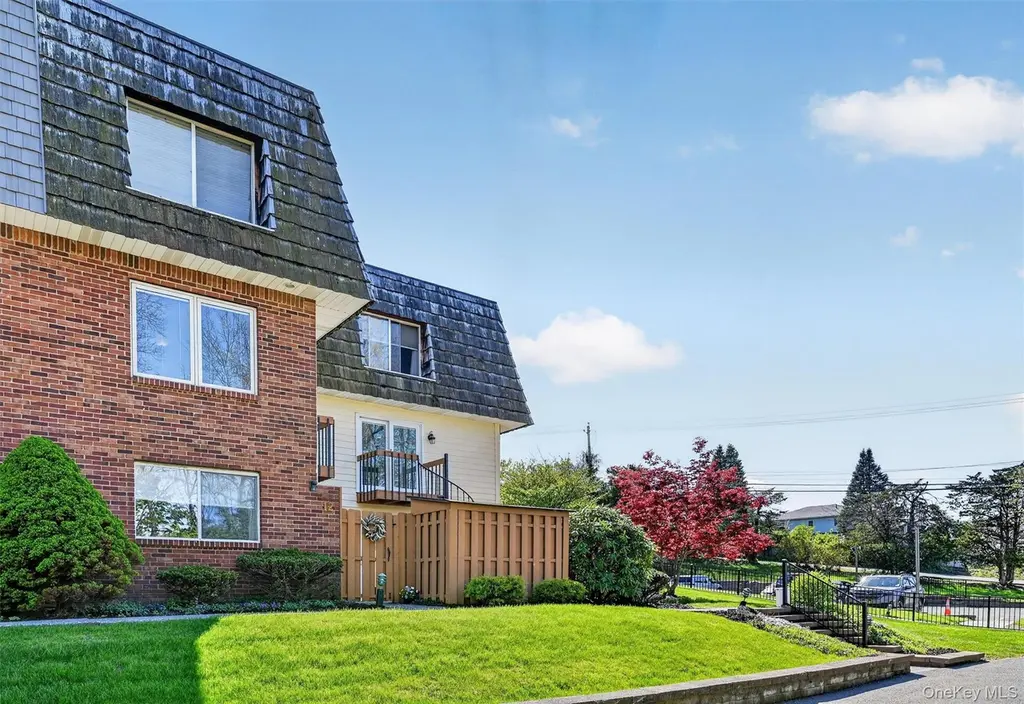
12 Laudaten Way
Warwick, NY 10990
$409,900D-
2 bd · 3.0 ba ·
2,601 sqft ·
Built 1986
· Townhouse
· Pending
· 27 DOM
Cashflow @ list (25.0% down · 7.5%)
Estimated rent
$3,115/mo
Mortgage (P&I)
−$2,150
Tax + insurance
−$854
HOA
−$340
Vac / Maint / Mgmt
−$654
Net cashflow
$-883/mo
Annual
$-10,595/yr
Cap rate
3.71%
Cash-on-cash
-9.23%
DSCR
0.59
1% rule
0.76%
Cash to close
$114,772
Investor read
- This is a 2-bed/3.0-bath townhouse listed at $410k.
- At list price, monthly cash flow is $-883 ($-11k/yr) — negative.
- To cash-flow at today's rent, offer at most $254k (38.0% below list).
- To meet the 1% rule (rent ≥ 1% of price), the offer needs to be $312k (24.0% below list).
- It's been on market 27 days — a 2% lower offer ($404k) is reasonable based on typical stale-listing flexibility.
- Recommended offer: $254k (38.0% below list) — sets the bar for cash-flow.
- Local home prices are declining (-3.0%/yr); year-one equity from $3k of loan paydown is wiped out by about $12k of value loss. Plan a longer hold.
- Location reads 74/100 on livability (#282 in NY, #4,514 nationally) — a middle-class / working-renter tenant base. Strengths: employment A+, housing A+, health & safety A+; Watch: amenities F, commute F, cost of living F.
- Warwick Valley Central School District (town): math 68% / reading 70% proficiency, ranked #118 of 590 in NY (top 20%) — acceptable for families but not a draw, mixed tenant base, ~2y average lease; only 10% free/reduced lunch — higher-income household profile.
- Zoned schools: Park Avenue Elementary School (math 67% / reading 67%, grade B+, #525 of 2,108 statewide, top 27%, 482 students, 22% FRL); Warwick Valley Middle School (math 51% / reading 63%, grade B, #192 of 729 statewide, top 28%, 1,082 students, 0% FRL); Warwick Valley High School (math 95% / reading 98%, grade A+, #59 of 1,100 statewide, top 6%, 1,366 students, 0% FRL) — zoned schools at 7% FRL track the district average.
- Market conditions: 164 active listings in the ZIP; 2 comparable units currently listed for rent nearby; high-income renter base; 1,746 units permitted in Orange County in 2024 (1,265 in 5+ unit buildings).
- Current owner paid $135k; list at $410k implies a 204% gain — meaningful room to come down on a strong offer.
- Climate carrying-cost: moderate wildfire risk; extreme-heat days projected 7→16/yr by 2055 (HVAC capex compounding) — expect insurance premiums to compound above CPI over the hold.
- Cap rate 3.7% vs local median 2.8% in Warwick — top-decile yield for the area; either an underpriced asset or a hidden risk that comps aren't pricing in. Stress-test before assuming the spread holds.
Questions for listing agent
- What do current leases actually rent for vs. the listed asking? Can we see a recent rent roll and the last 12 months of T-12 income?
- What does the HOA fee cover, when was the last increase, and are there any pending special assessments or reserve-fund shortfalls?
- Is there a deadline driving the sale (1031 exchange, divorce, estate, relocation)? That informs how much negotiation room exists.
- Schools are A-rated — typically a magnet for longer-tenancy family renters. What's the average tenant stay here, and is there a school-zone premium baked into asking?
- The area grade is low — what's the realistic commute time and amenity access for the typical tenant pool here? Any planned neighborhood developments (good or bad) we should know about?
- What's the average days-on-market for RENTAL listings here right now (not sales)? A rising rental-DOM trend means longer vacancies and softer asking-rent achievability than the comps imply.
- What's the recent tenant-quality profile in this submarket — average credit score on applications, eviction rate, late-payment / NSF rate, and stable-employment percentage? A property-management company in the area should have these aggregated.
- How much new for-sale + rental construction is in the pipeline within 1–3 miles? Heavy new supply typically softens prices + rents 12–24 months out; constrained supply supports both.
CashFlowRE · CFR-EJ1WZP49TF3TZJ
· Data 3 days ago
cashflowre.app · 2026-05-29