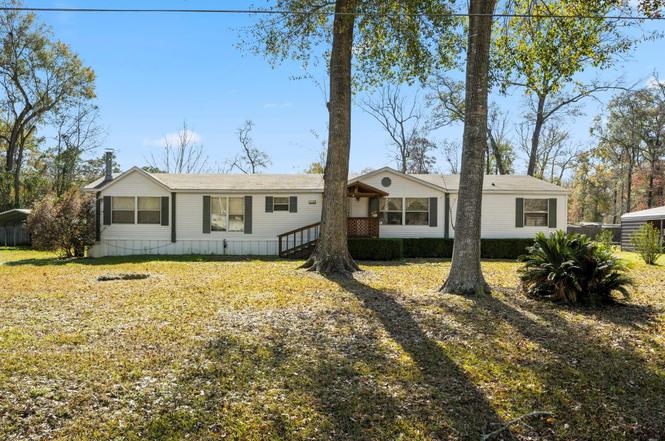
171 County Road 4322
Liberty, TX 77535
$240,000D+
4 bd · 2.5 ba ·
2,488 sqft ·
Built 2002
· Manufactured
· Active
· 260 DOM
Cashflow @ list (25.0% down · 7.5%)
Estimated rent
$1,859/mo
Mortgage (P&I)
−$1,259
Tax + insurance
−$182
HOA
−$0
Vac / Maint / Mgmt
−$390
Net cashflow
$28/mo
Annual
$337/yr
Cap rate
6.43%
Cash-on-cash
0.50%
DSCR
1.02
1% rule
0.77%
Cash to close
$67,200
Investor read
- This is a 4-bed/2.5-bath manufactured listed at $240k.
- At list price, monthly cash flow is $28 ($337/yr) — positive.
- The deal already cash-flows at list — no discount required.
- To meet the 1% rule (rent ≥ 1% of price), the offer needs to be $186k (22.6% below list).
- It's been on market 260 days — a 12% lower offer ($211k) is reasonable based on typical stale-listing flexibility.
- Recommended offer: $186k (22.6% below list) — sets the bar for 1% rule.
- Local home prices are declining (-3.0%/yr); year-one equity from $2k of loan paydown is wiped out by about $7k of value loss. Plan a longer hold.
- Location reads 68/100 on livability (#489 in TX) — a middle-class / working-renter tenant base. Strengths: cost of living A+, housing A+, health & safety A; Watch: employment D+, amenities F, commute F.
- Dayton ISD (town): math 34% / reading 35% proficiency, ranked #512 of 826 in TX (top 62%) — families likely to look elsewhere, expect single-tenant / working-renter base with shorter leases.
- Zoned schools: Kimmie M Brown El (math 26% / reading 25%, grade F, #2,982 of 4,322 statewide, top 70%, 845 students, 82% FRL); Dayton H S (math 45% / reading 45%, grade D-, #643 of 1,632 statewide, top 40%, 1,633 students, 66% FRL) — zoned schools average 74% FRL vs 54% district-wide (20 pts higher); higher-poverty schools than district average — tighter screening recommended.
- Market conditions: 1209 active listings in the ZIP; solid renter incomes; 1,321 units permitted in Liberty County in 2024 (0 in 5+ unit buildings).
- Liberty County population projected at +24% by 2050 — long-run rental-demand tailwind backs the buy-and-hold thesis.
- 3 sale attempts since 3y ago with the ask held roughly flat each time — persistent listings suggest the price (not the market) is what's stuck; bring a comps-based counter.
- Climate carrying-cost: severe wind risk, 99% chance of damaging wind over 30y; extreme-heat days projected 7→25/yr by 2055 (HVAC capex compounding) — expect insurance premiums to compound above CPI over the hold.
- Cap rate 6.4% vs local median 4.6% in Liberty — top-decile yield for the area; either an underpriced asset or a hidden risk that comps aren't pricing in. Stress-test before assuming the spread holds.
Questions for listing agent
- It's been on market 260 days. Have you received any prior offers? Is the seller open to a 23% concession, seller financing, or rate buy-down credit?
- Why hasn't it sold? Are there any deal-killer items the seller is aware of (foundation, flood, title, zoning, code violations)?
- Is there a deadline driving the sale (1031 exchange, divorce, estate, relocation)? That informs how much negotiation room exists.
- Schools are F-rated, which usually means shorter tenancies and higher turnover. Who's the typical renter profile here, and what's been the actual vacancy rate?
- The area grade is low — what's the realistic commute time and amenity access for the typical tenant pool here? Any planned neighborhood developments (good or bad) we should know about?
- What's the average days-on-market for RENTAL listings here right now (not sales)? A rising rental-DOM trend means longer vacancies and softer asking-rent achievability than the comps imply.
- What's the recent tenant-quality profile in this submarket — average credit score on applications, eviction rate, late-payment / NSF rate, and stable-employment percentage? A property-management company in the area should have these aggregated.
- How much new for-sale + rental construction is in the pipeline within 1–3 miles? Heavy new supply typically softens prices + rents 12–24 months out; constrained supply supports both.
CashFlowRE · CFR-EKBX6E17KBJAJ4
· Data 2 days ago
cashflowre.app · 2026-05-29