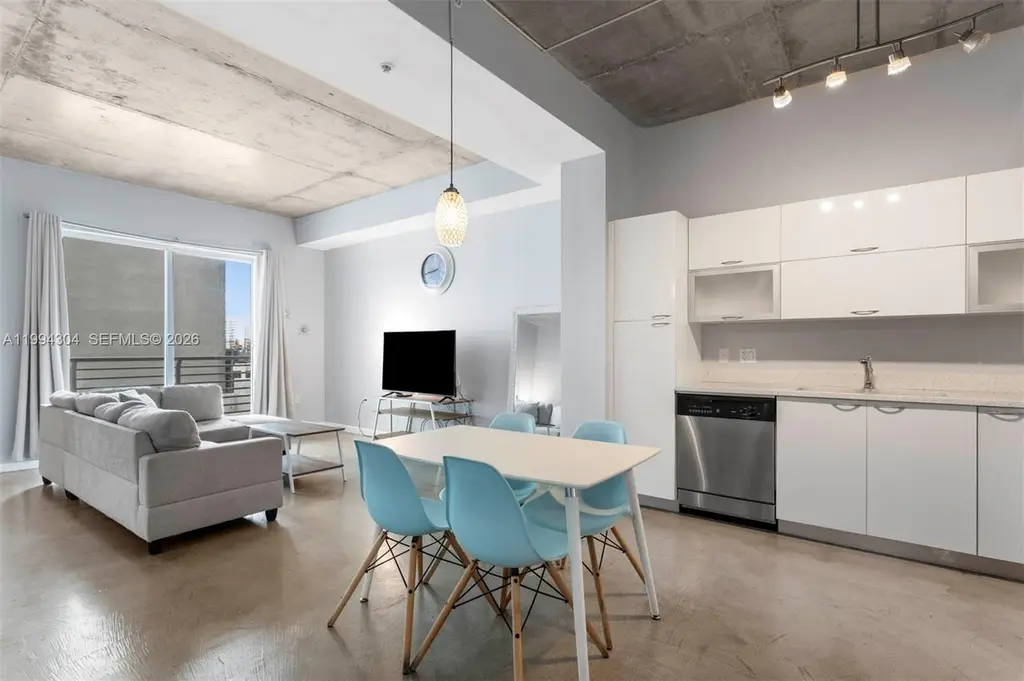
234 NE 3rd St #1106
Miami, FL 33132
$289,000C
1 bd · 1.0 ba ·
738 sqft ·
Built 2005
· Condo
· Active
· 76 DOM
Cashflow @ list (25.0% down · 7.5%)
Estimated rent
$3,922/mo
Mortgage (P&I)
−$1,516
Tax + insurance
−$497
HOA
−$874
Vac / Maint / Mgmt
−$824
Net cashflow
$211/mo
Annual
$2,535/yr
Cap rate
7.17%
Cash-on-cash
3.13%
DSCR
1.14
1% rule
1.36%
Cash to close
$80,920
Investor read
- This is a 1-bed/1.0-bath condo listed at $289k.
- At list price, monthly cash flow is $211 ($3k/yr) — positive.
- The deal already cash-flows at list — no discount required.
- Meets the 1% rule at list price ($4k rent vs $289k).
- It's been on market 76 days — a 6% lower offer ($272k) is reasonable based on typical stale-listing flexibility.
- Recommended offer: $272k (6.0% below list) — sets the bar for market timing.
- Local home prices are declining (-2.5%/yr); year-one equity from $2k of loan paydown is wiped out by about $7k of value loss. Plan a longer hold.
- Location reads 78/100 on livability (#177 in FL, #2,724 nationally) — a middle-class / working-renter tenant base. Strengths: amenities A+, commute A+, health & safety A+; Watch: employment C-, crime F, cost of living F.
- Miami-Dade (suburban): math 45% / reading 54% proficiency, ranked #40 of 73 in FL (top 55%) — families likely to look elsewhere, expect single-tenant / working-renter base with shorter leases; 64% free/reduced lunch — lower-income household profile, screen leases tightly.
- Watch-outs: HOA is 22% of rent.
- Market conditions: Rents flat; 869 active listings in the ZIP; solid renter incomes; 10,051 units permitted in Miami-Dade County in 2024 (7,758 in 5+ unit buildings).
- Miami-Dade County population projected at +28% by 2050 — long-run rental-demand tailwind backs the buy-and-hold thesis.
- 3 sale attempts since 13y ago with the ask held roughly flat each time — persistent listings suggest the price (not the market) is what's stuck; bring a comps-based counter.
- Current owner paid $190k; list at $289k implies a 52% gain — meaningful room to come down on a strong offer.
- Climate carrying-cost: moderate flood risk; severe wind risk, 99% chance of damaging wind over 30y; extreme-heat days projected 5→19/yr by 2055 (HVAC capex compounding) — expect insurance premiums to compound above CPI over the hold.
- Cap rate 7.2% vs local median 1.9% in Miami — top-decile yield for the area; either an underpriced asset or a hidden risk that comps aren't pricing in. Stress-test before assuming the spread holds.
- This rent runs 43% of the median local income ($109k/yr) — at the standard rent-burdened threshold; future hikes will face affordability resistance.
Questions for listing agent
- It's been on market 76 days. Have you received any prior offers? Is the seller open to a 6% concession, seller financing, or rate buy-down credit?
- What does the HOA fee cover, when was the last increase, and are there any pending special assessments or reserve-fund shortfalls?
- Any open or pending special assessments — roof, HVAC, plumbing, elevator, façade? What's the per-unit balance and payoff schedule, and is the seller paying it off at close or rolling it to the buyer?
- Why hasn't it sold? Are there any deal-killer items the seller is aware of (foundation, flood, title, zoning, code violations)?
- Is there a deadline driving the sale (1031 exchange, divorce, estate, relocation)? That informs how much negotiation room exists.
- Schools are B-rated — typically a magnet for longer-tenancy family renters. What's the average tenant stay here, and is there a school-zone premium baked into asking?
- Crime grade is F in this area — have there been break-ins, vandalism, or insurance claims at this property in the last 3 years? What carrier currently insures it and at what premium?
- What's the average days-on-market for RENTAL listings here right now (not sales)? A rising rental-DOM trend means longer vacancies and softer asking-rent achievability than the comps imply.
CashFlowRE · CFR-ENAPHT4T98M4MD
· Data 2 days ago
cashflowre.app · 2026-05-29