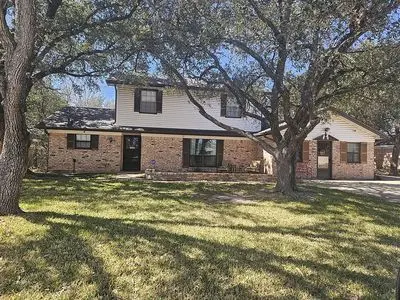
3714 Sunnybrook Ln
Bryan, TX 77802
$260,000D+
4 bd · 2.0 ba ·
2,192 sqft ·
Built 1976
· SingleFamily
· Under Contract
Cashflow @ list (25.0% down · 7.5%)
Estimated rent
$2,409/mo
Mortgage (P&I)
−$1,363
Tax + insurance
−$572
HOA
−$0
Vac / Maint / Mgmt
−$506
Net cashflow
$-33/mo
Annual
$-396/yr
Cap rate
6.14%
Cash-on-cash
-0.54%
DSCR
0.98
1% rule
0.93%
Cash to close
$72,800
Investor read
- This is a 4-bed/2.0-bath single-family listed at $260k.
- At list price, monthly cash flow is $-33 ($-396/yr) — negative.
- To cash-flow at today's rent, offer at most $254k (2.2% below list).
- To meet the 1% rule (rent ≥ 1% of price), the offer needs to be $241k (7.4% below list).
- Only 0 days on market — expect competitive offers; lowballing is unlikely to land.
- Recommended offer: $241k (7.4% below list) — sets the bar for 1% rule.
- Local home prices are declining (-3.0%/yr); year-one equity from $2k of loan paydown is wiped out by about $8k of value loss. Plan a longer hold.
- Location reads 76/100 on livability (#99 in TX, #3,341 nationally) — a middle-class / working-renter tenant base. Strengths: cost of living A+, housing A+, health & safety A+; Watch: schools C-, crime C-, amenities C-.
- Bryan ISD (urban): math 30% / reading 32% proficiency, ranked #608 of 826 in TX (top 74%) — families likely to look elsewhere, expect single-tenant / working-renter base with shorter leases; 68% free/reduced lunch — lower-income household profile, screen leases tightly.
- Market conditions: Rents rising (+1.8%/yr); 278 active listings in the ZIP; 11 comparable units currently listed for rent nearby; rentals at typical pace (median 21d on market — plan ~3-4 weeks tenant-placement turnaround); 2,211 units permitted in Brazos County in 2024 (768 in 5+ unit buildings).
- Brazos County population projected at +55% by 2050 — long-run rental-demand tailwind backs the buy-and-hold thesis.
- Climate carrying-cost: severe wind risk, 80% chance of damaging wind over 30y; extreme-heat days projected 7→24/yr by 2055 (HVAC capex compounding) — expect insurance premiums to compound above CPI over the hold.
- Cap rate 6.1% vs local median 4.0% in Bryan — top-decile yield for the area; either an underpriced asset or a hidden risk that comps aren't pricing in. Stress-test before assuming the spread holds.
- This rent runs 41% of the median local income ($71k/yr) — at the standard rent-burdened threshold; future hikes will face affordability resistance.
Questions for listing agent
- What do current leases actually rent for vs. the listed asking? Can we see a recent rent roll and the last 12 months of T-12 income?
- Built in 1976 — when were the roof, HVAC, electrical panel, plumbing, and water heater last replaced?
- Is there a deadline driving the sale (1031 exchange, divorce, estate, relocation)? That informs how much negotiation room exists.
- The area grade is low — what's the realistic commute time and amenity access for the typical tenant pool here? Any planned neighborhood developments (good or bad) we should know about?
- What's the average days-on-market for RENTAL listings here right now (not sales)? A rising rental-DOM trend means longer vacancies and softer asking-rent achievability than the comps imply.
- What's the recent tenant-quality profile in this submarket — average credit score on applications, eviction rate, late-payment / NSF rate, and stable-employment percentage? A property-management company in the area should have these aggregated.
- How much new for-sale + rental construction is in the pipeline within 1–3 miles? Heavy new supply typically softens prices + rents 12–24 months out; constrained supply supports both.
CashFlowRE · CFR-ER0WTXF447Y2WH
· Data 6 days ago
cashflowre.app · 2026-05-29