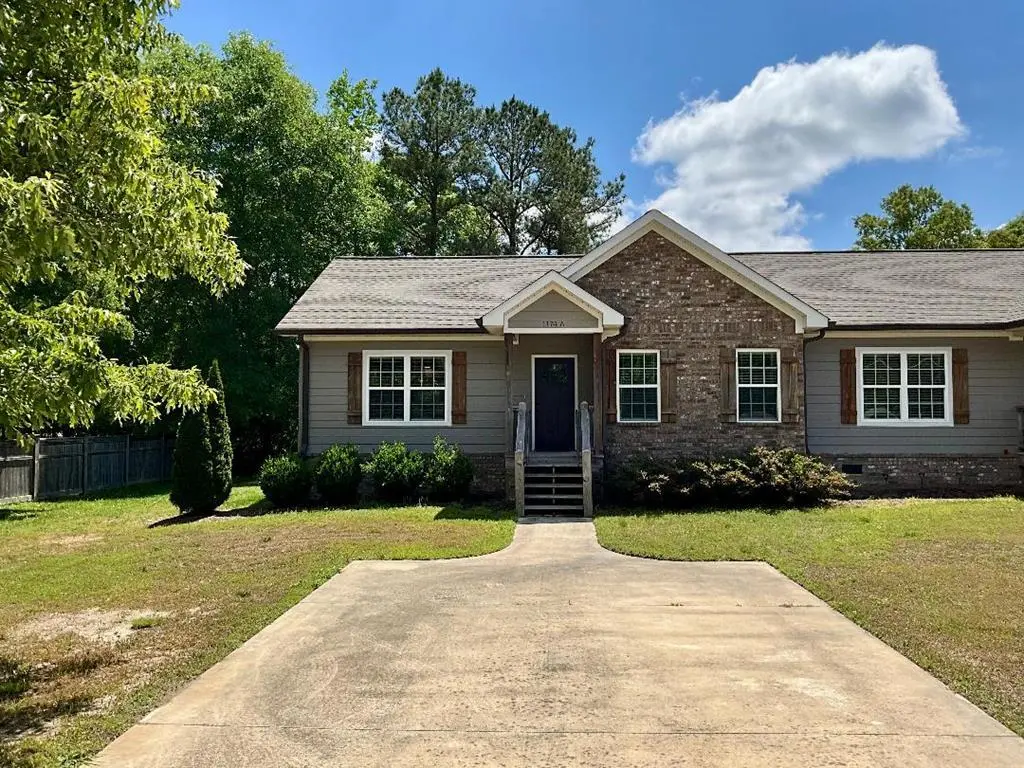
1174 A Beaverdale Road Rd NE
Varnell, GA 30721
$1,400D
4 bd · 4.0 ba ·
1,090 sqft ·
Built 2020
· MultiFamily
· Active
· 3 DOM
Cashflow @ list (25.0% down · 7.5%)
Estimated rent
$2,214/mo
Mortgage (P&I)
−$7
Tax + insurance
−$2
HOA
−$0
Vac / Maint / Mgmt
−$465
Net cashflow
$1,739/mo
Annual
$20,873/yr
Cap rate
1497.19%
Cash-on-cash
5324.65%
DSCR
237.92
1% rule
158.14%
Cash to close
$392
Investor read
- This is a 2 × 2-bed/2.0-bath units multifamily listed at $1k.
- At list price, monthly cash flow is $2k ($21k/yr) — positive. Per door: $870/mo.
- The deal already cash-flows at list — no discount required.
- Meets the 1% rule at list price ($2k rent vs $1k).
- Only 3 days on market — expect competitive offers; lowballing is unlikely to land.
- Local home prices are declining (-3.0%/yr); year-one equity from $10 of loan paydown is wiped out by about $42 of value loss. Plan a longer hold.
- Location reads 64/100 on livability (#276 in GA) — a middle-class / working-renter tenant base. Strengths: crime A+, cost of living A+, housing A+; Watch: amenities F, commute F, health & safety F.
- Whitfield County (rural): math 37% / reading 34% proficiency, ranked #62 of 174 in GA (top 36%) — families likely to look elsewhere, expect single-tenant / working-renter base with shorter leases; 61% free/reduced lunch — lower-income household profile, screen leases tightly.
- Zoned schools: Beaverdale Elementary School (math 37% / reading 27%, grade F, #582 of 1,228 statewide, top 50%, 496 students, 60% FRL); Coahulla Creek High School (math 25% / reading 30%, grade F, #158 of 424 statewide, top 37%, 986 students, 58% FRL) — zoned schools at 58% FRL track the district average.
- Market conditions: 384 active listings in the ZIP; 374 units permitted in Whitfield County in 2024 (35 in 5+ unit buildings).
- Whitfield County population projected at +3% by 2050 — modest demand growth; plan on rents tracking national, not racing it.
- At projected returns (-3.0% appreciation + 3.0% rent growth), your $392 cash investment doubles in ~1 year — after that, you're playing with house money.
- Climate carrying-cost: major wildfire risk; extreme-heat days projected 7→19/yr by 2055 (HVAC capex compounding) — expect insurance premiums to compound above CPI over the hold.
- Cap rate 1497.2% vs local median 2.5% in Varnell — top-decile yield for the area; either an underpriced asset or a hidden risk that comps aren't pricing in. Stress-test before assuming the spread holds.
- This rent runs 43% of the median local income ($62k/yr) — at the standard rent-burdened threshold; future hikes will face affordability resistance.
Questions for listing agent
- Can we see the unit-by-unit rent roll, current vacancy, and any below-market leases? What's the average tenancy length?
- What capital expenditures (roof, boiler, parking lot, exteriors) have been made in the last 5 years, and what's planned in the next 2?
- Is there a deadline driving the sale (1031 exchange, divorce, estate, relocation)? That informs how much negotiation room exists.
- Schools are F-rated, which usually means shorter tenancies and higher turnover. Who's the typical renter profile here, and what's been the actual vacancy rate?
- The area grade is low — what's the realistic commute time and amenity access for the typical tenant pool here? Any planned neighborhood developments (good or bad) we should know about?
- What's the average days-on-market for RENTAL listings here right now (not sales)? A rising rental-DOM trend means longer vacancies and softer asking-rent achievability than the comps imply.
- What's the recent tenant-quality profile in this submarket — average credit score on applications, eviction rate, late-payment / NSF rate, and stable-employment percentage? A property-management company in the area should have these aggregated.
- How much new apartment / multifamily construction is in the pipeline within 1–3 miles? Heavy new supply (>2% of stock underway) typically softens rents 12–24 months out; light construction supports rent growth.
CashFlowRE · CFR-ETSCXEFW39FWR0
· Data 3 weeks ago
cashflowre.app · 2026-05-29