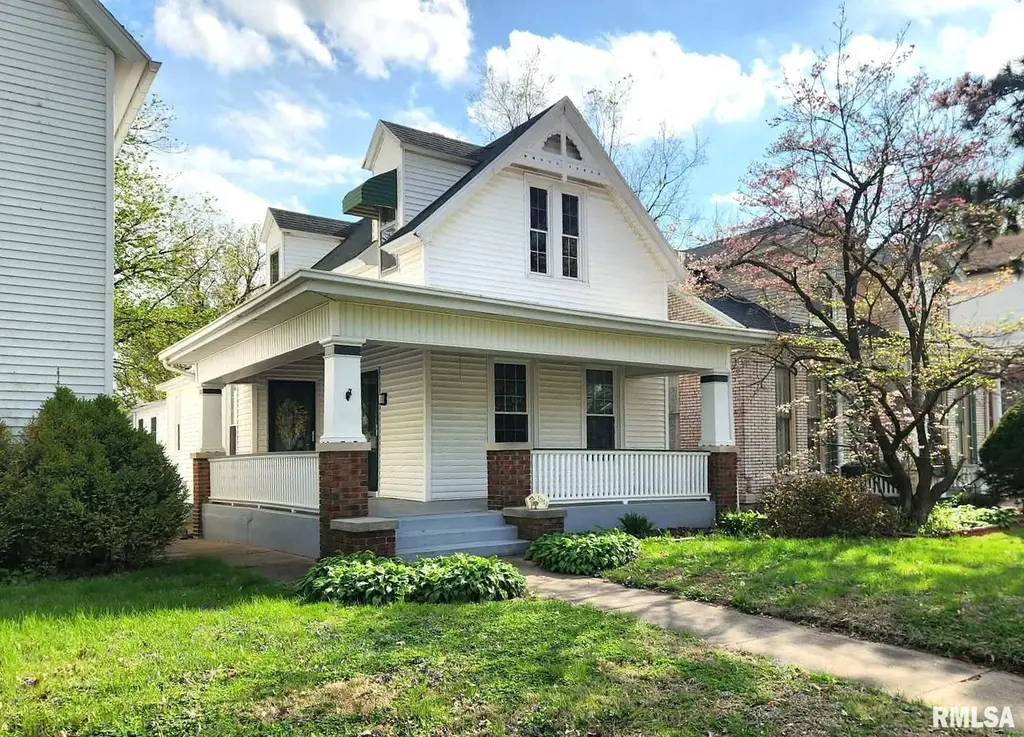
1512 State St
Quincy, IL 62301
$148,900C+
2 bd · 1.0 ba ·
1,600 sqft ·
Built —
· SingleFamily
· Under Contract
· 53 DOM
Cashflow @ list (25.0% down · 7.5%)
Estimated rent
$1,644/mo
Mortgage (P&I)
−$781
Tax + insurance
−$222
HOA
−$0
Vac / Maint / Mgmt
−$345
Net cashflow
$296/mo
Annual
$3,547/yr
Cap rate
8.68%
Cash-on-cash
8.51%
DSCR
1.38
1% rule
1.10%
Cash to close
$41,692
Investor read
- This is a 2-bed/1.0-bath single-family listed at $149k.
- At list price, monthly cash flow is $296 ($4k/yr) — positive.
- The deal already cash-flows at list — no discount required.
- Meets the 1% rule at list price ($2k rent vs $149k).
- It's been on market 53 days — a 3% lower offer ($144k) is reasonable based on typical stale-listing flexibility.
- Recommended offer: $144k (3.0% below list) — sets the bar for market timing.
- Local home prices are declining (-3.0%/yr); year-one equity from $1k of loan paydown is wiped out by about $4k of value loss. Plan a longer hold.
- Location reads 67/100 on livability (#506 in IL) — a middle-class / working-renter tenant base. Strengths: cost of living A+, housing A+; Watch: schools D+, crime D, employment D.
- Quincy SD 172 (town): math 24% / reading 27% proficiency, ranked #328 of 620 in IL (top 53%) — low school quality limits family demand, transient renter base, plan for 1-2y turnover.
- Market conditions: Rents rising fast (+10.8%/yr); 180 active listings in the ZIP; 2 comparable units currently listed for rent nearby; 68 units permitted in Adams County in 2024 (0 in 5+ unit buildings).
- Adams County population projected at -14% by 2050 — secular population decline; favor cash flow + early exit over multi-decade hold.
- 4 sale attempts since 7y ago with the ask held roughly flat each time — persistent listings suggest the price (not the market) is what's stuck; bring a comps-based counter.
- Current owner paid $95k; list at $149k implies a 57% gain — meaningful room to come down on a strong offer.
- At projected returns (-3.0% appreciation + 8.0% rent growth), your $42k cash investment doubles in ~8 years — after that, you're playing with house money.
- Cap rate 8.7% vs local median 4.3% in Quincy — top-decile yield for the area; either an underpriced asset or a hidden risk that comps aren't pricing in. Stress-test before assuming the spread holds.
- This rent runs 38% of the median local income ($52k/yr) — at the standard rent-burdened threshold; future hikes will face affordability resistance.
Questions for listing agent
- It's been on market 53 days. Have you received any prior offers? Is the seller open to a 3% concession, seller financing, or rate buy-down credit?
- Is there a deadline driving the sale (1031 exchange, divorce, estate, relocation)? That informs how much negotiation room exists.
- Schools are D-rated, which usually means shorter tenancies and higher turnover. Who's the typical renter profile here, and what's been the actual vacancy rate?
- Crime grade is D in this area — have there been break-ins, vandalism, or insurance claims at this property in the last 3 years? What carrier currently insures it and at what premium?
- What's the average days-on-market for RENTAL listings here right now (not sales)? A rising rental-DOM trend means longer vacancies and softer asking-rent achievability than the comps imply.
- What's the recent tenant-quality profile in this submarket — average credit score on applications, eviction rate, late-payment / NSF rate, and stable-employment percentage? A property-management company in the area should have these aggregated.
- How much new for-sale + rental construction is in the pipeline within 1–3 miles? Heavy new supply typically softens prices + rents 12–24 months out; constrained supply supports both.
CashFlowRE · CFR-F021WD66E73W6V
· Data 1 week ago
cashflowre.app · 2026-05-29