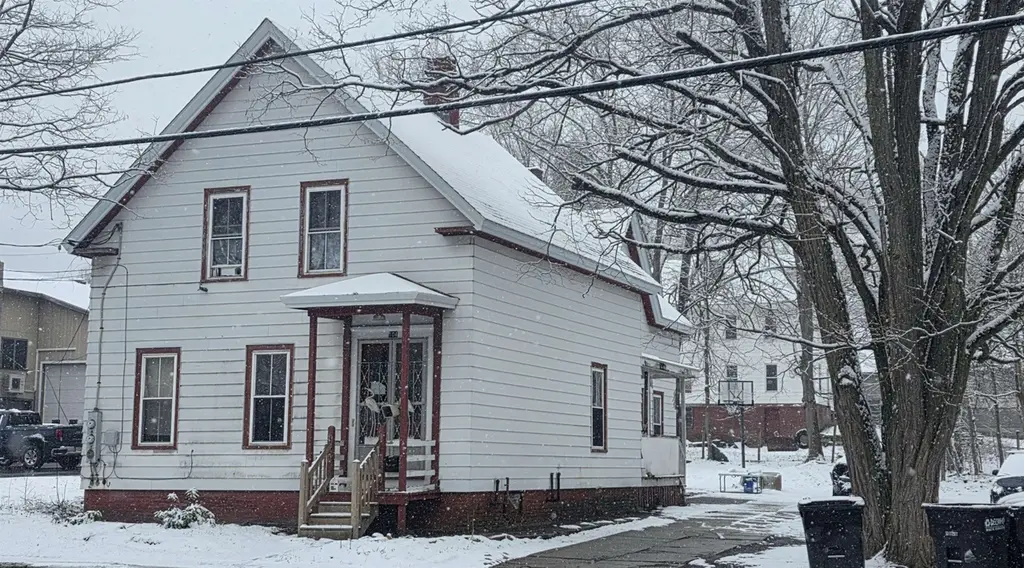
104 Summer St
Claremont, NH 03743
$265,000B-
5 bd · 2.0 ba ·
2,293 sqft ·
Built 1930
· MultiFamily
· Active
· 63 DOM
Cashflow @ list (25.0% down · 7.5%)
Estimated rent
$3,891/mo
Mortgage (P&I)
−$1,390
Tax + insurance
−$514
HOA
−$0
Vac / Maint / Mgmt
−$817
Net cashflow
$1,170/mo
Annual
$14,038/yr
Cap rate
11.59%
Cash-on-cash
18.92%
DSCR
1.84
1% rule
1.47%
Cash to close
$74,200
Investor read
- This is a 2 × 3-bed/1-bath units multifamily listed at $265k.
- At list price, monthly cash flow is $1k ($14k/yr) — positive. Per door: $585/mo.
- The deal already cash-flows at list — no discount required.
- Meets the 1% rule at list price ($4k rent vs $265k).
- It's been on market 63 days — a 6% lower offer ($249k) is reasonable based on typical stale-listing flexibility.
- Recommended offer: $249k (6.0% below list) — sets the bar for market timing.
- In year one you build about $2k of equity ($2k loan paydown + $534 appreciation (0.2% local appreciation)).
- Location reads 69/100 on livability (#50 in NH) — a middle-class / working-renter tenant base. Strengths: cost of living A+, health & safety A+, housing A; Watch: employment C-, schools D-, amenities F.
- Claremont School District (town): math 24% / reading 35% proficiency, ranked #85 of 98 in NH (top 87%) — low school quality limits family demand, transient renter base, plan for 1-2y turnover.
- Watch-outs: built in 1930 — expect roof / HVAC / electrical / plumbing capex.
- Market conditions: 58 active listings in the ZIP; 1 comparable units currently listed for rent nearby; 98 units permitted in Sullivan County in 2024 (0 in 5+ unit buildings).
- Sullivan County population projected at -20% by 2050 — secular population decline; favor cash flow + early exit over multi-decade hold.
- 2 sale attempts since 2y ago with the ask held roughly flat each time — persistent listings suggest the price (not the market) is what's stuck; bring a comps-based counter.
- At projected returns (0.2% appreciation + 3.0% rent growth), your $74k cash investment doubles in ~5 years — after that, you're playing with house money.
- By year 10, paydown + projected appreciation supports a ~$30k cash-out refi (75% LTV) — recoverable capital for the next deal without selling this one.
- Cap rate 11.6% vs local median 3.2% in Claremont — top-decile yield for the area; either an underpriced asset or a hidden risk that comps aren't pricing in. Stress-test before assuming the spread holds.
- At $3,891/mo this rent would consume 78% of the median local household income ($60k/yr) (locally 642% of renters already pay >50% of income on rent) — very limited rent-growth headroom before tenants either downsize or default.
Questions for listing agent
- It's been on market 63 days. Have you received any prior offers? Is the seller open to a 6% concession, seller financing, or rate buy-down credit?
- Can we see the unit-by-unit rent roll, current vacancy, and any below-market leases? What's the average tenancy length?
- What capital expenditures (roof, boiler, parking lot, exteriors) have been made in the last 5 years, and what's planned in the next 2?
- Built in 1930 — when were the roof, HVAC, electrical panel, plumbing, and water heater last replaced?
- Why hasn't it sold? Are there any deal-killer items the seller is aware of (foundation, flood, title, zoning, code violations)?
- Is there a deadline driving the sale (1031 exchange, divorce, estate, relocation)? That informs how much negotiation room exists.
- Schools are D-rated, which usually means shorter tenancies and higher turnover. Who's the typical renter profile here, and what's been the actual vacancy rate?
- What's the average days-on-market for RENTAL listings here right now (not sales)? A rising rental-DOM trend means longer vacancies and softer asking-rent achievability than the comps imply.
CashFlowRE · CFR-F13R7Z1FE9B2CK
· Data 1 day ago
cashflowre.app · 2026-05-29