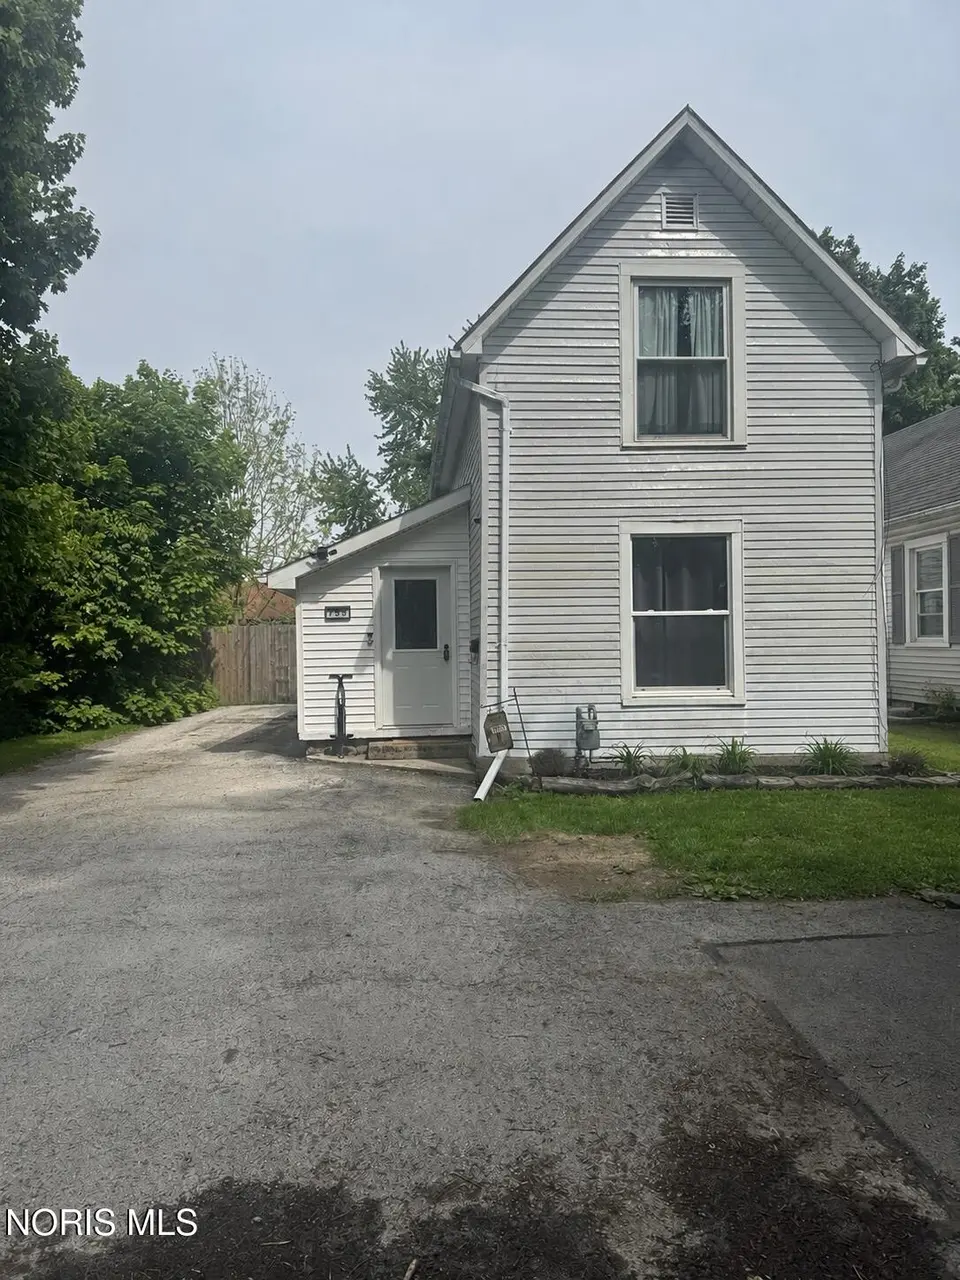
755 Dayton Ave
Findlay, OH 45840
$183,000D-
3 bd · 1.0 ba ·
983 sqft ·
Built 1915
· SingleFamily
· Active
· 30 DOM
Cashflow @ list (25.0% down · 7.5%)
Estimated rent
$1,388/mo
Mortgage (P&I)
−$960
Tax + insurance
−$165
HOA
−$0
Vac / Maint / Mgmt
−$292
Net cashflow
$-28/mo
Annual
$-337/yr
Cap rate
6.11%
Cash-on-cash
-0.66%
DSCR
0.97
1% rule
0.76%
Cash to close
$51,240
Investor read
- This is a 3-bed/1.0-bath single-family listed at $183k.
- At list price, monthly cash flow is $-28 ($-337/yr) — negative.
- To cash-flow at today's rent, offer at most $178k (2.7% below list).
- To meet the 1% rule (rent ≥ 1% of price), the offer needs to be $139k (24.1% below list).
- It's been on market 30 days — a 2% lower offer ($180k) is reasonable based on typical stale-listing flexibility.
- Recommended offer: $139k (24.1% below list) — sets the bar for 1% rule.
- Local home prices are declining (-3.0%/yr); year-one equity from $1k of loan paydown is wiped out by about $5k of value loss. Plan a longer hold.
- Location reads 81/100 on livability (#98 in OH, #1,496 nationally) — a professional / high-income tenant draw. Strengths: amenities A+, cost of living A+, housing A+; Watch: employment D+, commute F.
- Findlay City (town): math 56% / reading 56% proficiency, ranked #357 of 656 in OH (top 54%) — acceptable for families but not a draw, mixed tenant base, ~2y average lease.
- Zoned schools: Northview Primary School (math 57% / reading 57%, grade C+, #729 of 1,584 statewide, top 48%, 361 students, 54% FRL); Donnell Middle School (math 57% / reading 54%, grade B-, #321 of 654 statewide, top 51%, 523 students, 41% FRL); Findlay High School (math 51% / reading 60%, grade C, #296 of 781 statewide, top 39%, 1,915 students, 31% FRL) — zoned schools at 42% FRL track the district average.
- Watch-outs: built in 1915 — expect roof / HVAC / electrical / plumbing capex.
- Market conditions: Rents rising fast (+5.7%/yr); 219 active listings in the ZIP; 2 comparable units currently listed for rent nearby; 257 units permitted in Hancock County in 2024 (150 in 5+ unit buildings).
- Hancock County population projected to shrink 4% by 2050 — rents likely to lag national; underwrite the cash flow, not the appreciation.
- 4 sale attempts since 7y ago with the ask held roughly flat each time — persistent listings suggest the price (not the market) is what's stuck; bring a comps-based counter.
- Current owner paid $137k; 34% above their basis — modest negotiation headroom, anchor on the comps not their cost.
- Cap rate 6.1% vs local median 5.0% in Findlay — meaningfully above typical; check what's discounted (condition, days-on-market, listing class) to confirm the premium yield is real.
Questions for listing agent
- What do current leases actually rent for vs. the listed asking? Can we see a recent rent roll and the last 12 months of T-12 income?
- Built in 1915 — when were the roof, HVAC, electrical panel, plumbing, and water heater last replaced?
- Is there a deadline driving the sale (1031 exchange, divorce, estate, relocation)? That informs how much negotiation room exists.
- Schools are B-rated — typically a magnet for longer-tenancy family renters. What's the average tenant stay here, and is there a school-zone premium baked into asking?
- The area grade is low — what's the realistic commute time and amenity access for the typical tenant pool here? Any planned neighborhood developments (good or bad) we should know about?
- What's the average days-on-market for RENTAL listings here right now (not sales)? A rising rental-DOM trend means longer vacancies and softer asking-rent achievability than the comps imply.
- What's the recent tenant-quality profile in this submarket — average credit score on applications, eviction rate, late-payment / NSF rate, and stable-employment percentage? A property-management company in the area should have these aggregated.
- How much new for-sale + rental construction is in the pipeline within 1–3 miles? Heavy new supply typically softens prices + rents 12–24 months out; constrained supply supports both.
CashFlowRE · CFR-F78PX7FABF9Y3D
· Data 1 day ago
cashflowre.app · 2026-05-29