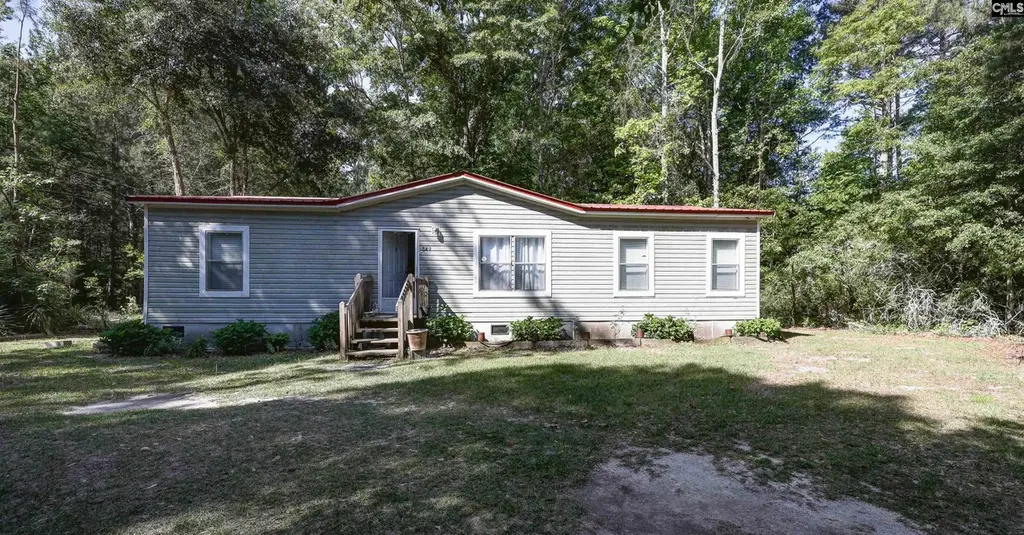
849 Swamp Rabbit Rd
Fairview Crossroads, SC 29070
$175,000C
2 bd · 1.0 ba ·
1,092 sqft ·
Built 2008
· Other
· Active
· 20 DOM
Cashflow @ list (25.0% down · 7.5%)
Estimated rent
$1,592/mo
Mortgage (P&I)
−$918
Tax + insurance
−$144
HOA
−$0
Vac / Maint / Mgmt
−$334
Net cashflow
$196/mo
Annual
$2,351/yr
Cap rate
7.64%
Cash-on-cash
4.80%
DSCR
1.21
1% rule
0.91%
Cash to close
$49,000
Investor read
- This is a 2-bed/1.0-bath other listed at $175k.
- At list price, monthly cash flow is $196 ($2k/yr) — positive.
- The deal already cash-flows at list — no discount required.
- To meet the 1% rule (rent ≥ 1% of price), the offer needs to be $159k (9.0% below list).
- It's been on market 20 days — a 2% lower offer ($172k) is reasonable based on typical stale-listing flexibility.
- Recommended offer: $159k (9.0% below list) — sets the bar for 1% rule.
- In year one you build about $19k of equity ($1k loan paydown + $18k appreciation (10.0% local appreciation)).
- Location reads: area grade C — affects rentability + tenant quality, not the cash-flow math above.
- Lexington 01 (suburban): math 42% / reading 53% proficiency, ranked #11 of 80 in SC (top 14%) — families likely to look elsewhere, expect single-tenant / working-renter base with shorter leases.
- Zoned schools: Pelion Elementary (math 21% / reading 24%, grade F, #472 of 597 statewide, top 79%, 611 students, 100% FRL); Pelion High (math 14% / reading 77%, grade D-, #164 of 196 statewide, top 84%, 727 students, 65% FRL) — zoned schools average 83% FRL vs 30% district-wide (52 pts higher); higher-poverty schools than district average — tighter screening recommended.
- Zoned-school proficiency averages 34% at this address vs 48% district-wide (-14 pts) — the specific schools serving this property underperform the Lexington 01 average; the district grade overstates school quality for this exact location.
- Market conditions: 167 active listings in the ZIP; 1,712 units permitted in Lexington County in 2024 (0 in 5+ unit buildings).
- Lexington County population projected at +26% by 2050 — long-run rental-demand tailwind backs the buy-and-hold thesis.
- 2 sale attempts since 3y ago with the ask held roughly flat each time — persistent listings suggest the price (not the market) is what's stuck; bring a comps-based counter.
- At projected returns (10.0% appreciation + 3.0% rent growth), your $49k cash investment doubles in ~3 years — after that, you're playing with house money.
- By year 2, paydown + projected appreciation supports a ~$30k cash-out refi (75% LTV) — recoverable capital for the next deal without selling this one.
- Climate carrying-cost: major wind risk, 67% chance of damaging wind over 30y; extreme-heat days projected 7→16/yr by 2055 (HVAC capex compounding) — expect insurance premiums to compound above CPI over the hold.
Questions for listing agent
- Is there a deadline driving the sale (1031 exchange, divorce, estate, relocation)? That informs how much negotiation room exists.
- This sits on a lake — are riparian / water-frontage rights deeded with the parcel? Any dock permits, shoreline easements, or HOA water-use restrictions?
- What's the documented flood / surge / shoreline-erosion history here (FEMA AND non-FEMA — e.g., storm surge, creek backup, septic-field saturation)?
- Any water-quality or seasonal algae-bloom issues that affect tenant satisfaction or short-term-rental demand?
- What's the average days-on-market for RENTAL listings here right now (not sales)? A rising rental-DOM trend means longer vacancies and softer asking-rent achievability than the comps imply.
- What's the recent tenant-quality profile in this submarket — average credit score on applications, eviction rate, late-payment / NSF rate, and stable-employment percentage? A property-management company in the area should have these aggregated.
- How much new for-sale + rental construction is in the pipeline within 1–3 miles? Heavy new supply typically softens prices + rents 12–24 months out; constrained supply supports both.
CashFlowRE · CFR-F7HFF65JQFSZMA
· Data 1 day ago
cashflowre.app · 2026-05-29