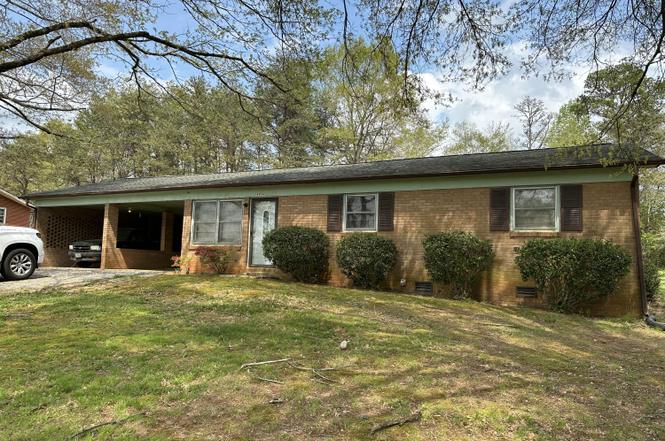
4974 6th St SW
Catawba, NC 28609
$190,000C+
3 bd · 1.0 ba ·
1,400 sqft ·
Built 1970
· SingleFamily
· Pending
· 15 DOM
Cashflow @ list (25.0% down · 7.5%)
Estimated rent
$1,887/mo
Mortgage (P&I)
−$996
Tax + insurance
−$221
HOA
−$0
Vac / Maint / Mgmt
−$396
Net cashflow
$273/mo
Annual
$3,281/yr
Cap rate
8.02%
Cash-on-cash
6.17%
DSCR
1.27
1% rule
0.99%
Cash to close
$53,200
Investor read
- This is a 3-bed/1.0-bath single-family listed at $190k.
- At list price, monthly cash flow is $273 ($3k/yr) — positive.
- The deal already cash-flows at list — no discount required.
- To meet the 1% rule (rent ≥ 1% of price), the offer needs to be $189k (0.7% below list).
- It's been on market 15 days — a 2% lower offer ($187k) is reasonable based on typical stale-listing flexibility.
- Recommended offer: $187k (1.5% below list) — sets the bar for market timing.
- Local home prices are declining (-3.0%/yr); year-one equity from $1k of loan paydown is wiped out by about $6k of value loss. Plan a longer hold.
- Location reads 61/100 on livability (#494 in NC) — a middle-class / working-renter tenant base. Strengths: cost of living A+, housing A-, health & safety B; Watch: crime F, amenities F, commute F.
- Catawba County Schools (rural): math 54% / reading 51% proficiency, ranked #54 of 178 in NC (top 30%) — acceptable for families but not a draw, mixed tenant base, ~2y average lease.
- Zoned schools: Catawba Elementary School (math 38% / reading 34%, grade F, #812 of 1,410 statewide, top 58%, 404 students, 70% FRL) — zoned schools average 70% FRL vs 43% district-wide (27 pts higher); higher-poverty schools than district average — tighter screening recommended.
- Zoned-school proficiency averages 36% at this address vs 52% district-wide (-16 pts) — the specific schools serving this property underperform the Catawba County Schools average; the district grade overstates school quality for this exact location.
- Market conditions: 92 active listings in the ZIP; 2,016 units permitted in Catawba County in 2024 (255 in 5+ unit buildings).
- Catawba County population projected to shrink 7% by 2050 — rents likely to lag national; underwrite the cash flow, not the appreciation.
- 2 sale attempts since 2y ago with the ask held roughly flat each time — persistent listings suggest the price (not the market) is what's stuck; bring a comps-based counter.
- Climate carrying-cost: extreme-heat days projected 7→17/yr by 2055 (HVAC capex compounding) — expect insurance premiums to compound above CPI over the hold.
- Cap rate 8.0% vs local median 3.9% in Catawba — top-decile yield for the area; either an underpriced asset or a hidden risk that comps aren't pricing in. Stress-test before assuming the spread holds.
Questions for listing agent
- Built in 1970 — when were the roof, HVAC, electrical panel, plumbing, and water heater last replaced?
- Is there a deadline driving the sale (1031 exchange, divorce, estate, relocation)? That informs how much negotiation room exists.
- Crime grade is F in this area — have there been break-ins, vandalism, or insurance claims at this property in the last 3 years? What carrier currently insures it and at what premium?
- What's the average days-on-market for RENTAL listings here right now (not sales)? A rising rental-DOM trend means longer vacancies and softer asking-rent achievability than the comps imply.
- What's the recent tenant-quality profile in this submarket — average credit score on applications, eviction rate, late-payment / NSF rate, and stable-employment percentage? A property-management company in the area should have these aggregated.
- How much new for-sale + rental construction is in the pipeline within 1–3 miles? Heavy new supply typically softens prices + rents 12–24 months out; constrained supply supports both.
CashFlowRE · CFR-F7Q2EKA2FF8VBQ
· Data 3 weeks ago
cashflowre.app · 2026-05-29