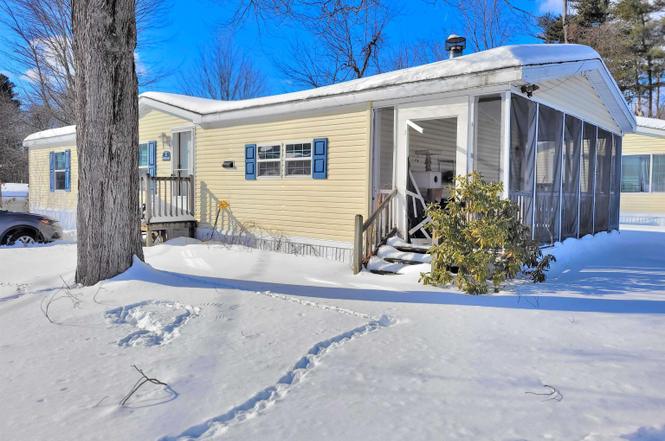
2 Darlene Ln
Nashua, NH 03052
$169,900D+
3 bd · 2.5 ba ·
1,184 sqft ·
Built 2002
· Manufactured
· Pending
· 36 DOM
Cashflow @ list (25.0% down · 7.5%)
Estimated rent
$2,075/mo
Mortgage (P&I)
−$891
Tax + insurance
−$228
HOA
−$675
Vac / Maint / Mgmt
−$436
Net cashflow
$-154/mo
Annual
$-1,851/yr
Cap rate
5.20%
Cash-on-cash
-3.89%
DSCR
0.83
1% rule
1.22%
Cash to close
$47,572
Investor read
- This is a 3-bed/2.5-bath manufactured listed at $170k.
- At list price, monthly cash flow is $-154 ($-2k/yr) — negative.
- To cash-flow at today's rent, offer at most $143k (16.0% below list).
- Meets the 1% rule at list price ($2k rent vs $170k).
- It's been on market 36 days — a 3% lower offer ($165k) is reasonable based on typical stale-listing flexibility.
- Recommended offer: $143k (16.0% below list) — sets the bar for cash-flow.
- Local home prices are declining (-3.0%/yr); year-one equity from $1k of loan paydown is wiped out by about $5k of value loss. Plan a longer hold.
- Location reads 83/100 on livability (#11 in NH, #983 nationally) — a professional / high-income tenant draw. Strengths: commute A+, housing A+, health & safety A+; Watch: amenities D+.
- Litchfield School District (rural): math 38% / reading 56% proficiency, ranked #34 of 98 in NH (top 35%) — families likely to look elsewhere, expect single-tenant / working-renter base with shorter leases; only 7% free/reduced lunch — higher-income household profile.
- Zoned schools: Griffin Memorial School (math 42% / reading 57%, grade D, #97 of 263 statewide, top 42%, 437 students, 10% FRL) — zoned schools at 10% FRL track the district average.
- Watch-outs: HOA is 33% of rent.
- Market conditions: 52 active listings in the ZIP; 1 comparable units currently listed for rent nearby; 981 units permitted in Hillsborough County in 2024 (381 in 5+ unit buildings).
- Hillsborough County population projected to shrink 8% by 2050 — rents likely to lag national; underwrite the cash flow, not the appreciation.
- 3 sale attempts since 4y ago; this cycle's ask has dropped $15k (8%) from the opening price — seller is motivated, your offer sets the floor, not the list.
- Current owner paid $135k; 26% above their basis — modest negotiation headroom, anchor on the comps not their cost.
- Cap rate 5.2% vs local median 2.9% in Nashua — top-decile yield for the area; either an underpriced asset or a hidden risk that comps aren't pricing in. Stress-test before assuming the spread holds.
Questions for listing agent
- What do current leases actually rent for vs. the listed asking? Can we see a recent rent roll and the last 12 months of T-12 income?
- It's been on market 36 days. Have you received any prior offers? Is the seller open to a 16% concession, seller financing, or rate buy-down credit?
- What does the HOA fee cover, when was the last increase, and are there any pending special assessments or reserve-fund shortfalls?
- Is there a deadline driving the sale (1031 exchange, divorce, estate, relocation)? That informs how much negotiation room exists.
- Schools are B-rated — typically a magnet for longer-tenancy family renters. What's the average tenant stay here, and is there a school-zone premium baked into asking?
- The area grade is low — what's the realistic commute time and amenity access for the typical tenant pool here? Any planned neighborhood developments (good or bad) we should know about?
- What's the average days-on-market for RENTAL listings here right now (not sales)? A rising rental-DOM trend means longer vacancies and softer asking-rent achievability than the comps imply.
- What's the recent tenant-quality profile in this submarket — average credit score on applications, eviction rate, late-payment / NSF rate, and stable-employment percentage? A property-management company in the area should have these aggregated.
CashFlowRE · CFR-FARZPXAA5F4A93
· Data 3 weeks ago
cashflowre.app · 2026-05-29