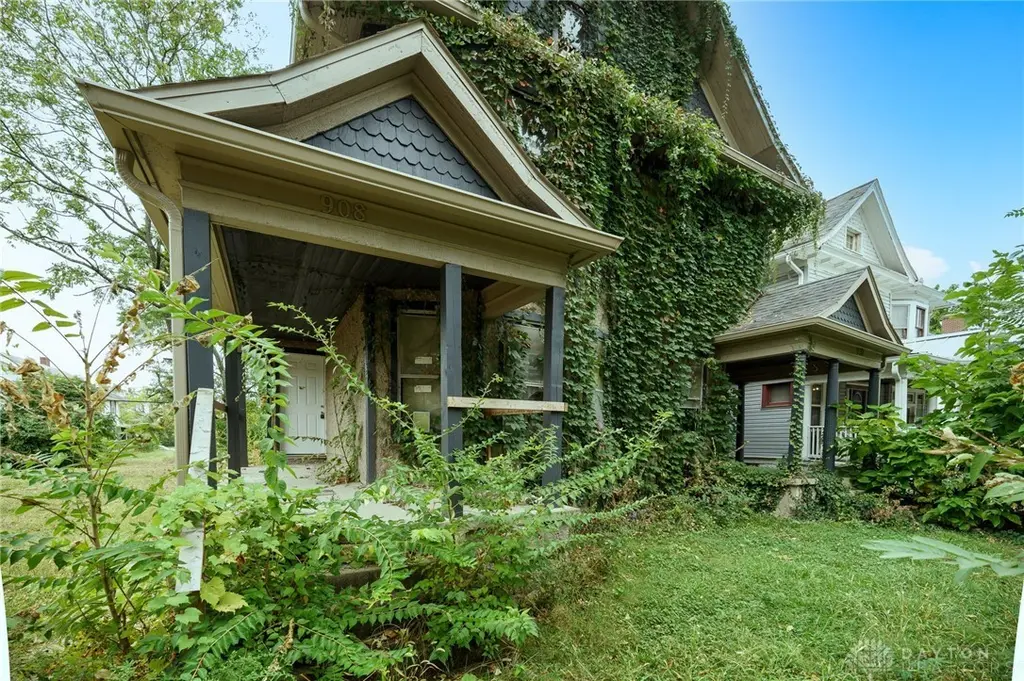
910 Harvard Blvd #908
Dayton, OH 45406
$79,000B
6 bd · 2.0 ba ·
3,353 sqft ·
Built 1905
· MultiFamily
· Active
· 51 DOM
Cashflow @ list (25.0% down · 7.5%)
Estimated rent
$2,346/mo
Mortgage (P&I)
−$414
Tax + insurance
−$132
HOA
−$0
Vac / Maint / Mgmt
−$493
Net cashflow
$1,307/mo
Annual
$15,689/yr
Cap rate
26.15%
Cash-on-cash
70.93%
DSCR
4.16
1% rule
2.97%
Cash to close
$22,120
Investor read
- This is a 2 × 3-bed/1.0-bath units multifamily listed at $79k. Condition is rated poor.
- At list price, monthly cash flow is $1k ($16k/yr) — positive. Per door: $654/mo.
- The deal already cash-flows at list — no discount required.
- Meets the 1% rule at list price ($2k rent vs $79k).
- It's been on market 51 days — a 3% lower offer ($77k) is reasonable based on typical stale-listing flexibility.
- Recommended offer: $77k (3.0% below list) — sets the bar for market timing.
- Local home prices are declining (-3.0%/yr); year-one equity from $546 of loan paydown is wiped out by about $2k of value loss. Plan a longer hold.
- Location reads 65/100 on livability (#716 in OH) — a middle-class / working-renter tenant base. Strengths: cost of living A+, housing A+, health & safety A; Watch: schools C-, amenities C-, crime F.
- Dayton City (urban): math 12% / reading 21% proficiency, ranked #641 of 656 in OH (top 98%) — low school quality limits family demand, transient renter base, plan for 1-2y turnover; 74% free/reduced lunch — lower-income household profile, screen leases tightly.
- Watch-outs: built in 1905 — expect roof / HVAC / electrical / plumbing capex.
- Market conditions: Rents rising (+3.0%/yr); 156 active listings in the ZIP; lower-income renter base — watch delinquency; 907 units permitted in Montgomery County in 2024 (416 in 5+ unit buildings).
- Montgomery County population projected at -10% by 2050 — secular population decline; favor cash flow + early exit over multi-decade hold.
- At projected returns (-3.0% appreciation + 3.0% rent growth), your $22k cash investment doubles in ~2 years — after that, you're playing with house money.
- Cap rate 26.2% vs local median 7.4% in Dayton — top-decile yield for the area; either an underpriced asset or a hidden risk that comps aren't pricing in. Stress-test before assuming the spread holds.
- At $2,346/mo this rent would consume 67% of the median local household income ($42k/yr) (locally 1504% of renters already pay >50% of income on rent) — very limited rent-growth headroom before tenants either downsize or default.
Questions for listing agent
- It's been on market 51 days. Have you received any prior offers? Is the seller open to a 3% concession, seller financing, or rate buy-down credit?
- Can we see the unit-by-unit rent roll, current vacancy, and any below-market leases? What's the average tenancy length?
- What capital expenditures (roof, boiler, parking lot, exteriors) have been made in the last 5 years, and what's planned in the next 2?
- Have any recent inspections been done? Can we get a copy of the seller's disclosures and any deferred-maintenance estimates?
- Built in 1905 — when were the roof, HVAC, electrical panel, plumbing, and water heater last replaced?
- Is there a deadline driving the sale (1031 exchange, divorce, estate, relocation)? That informs how much negotiation room exists.
- Crime grade is F in this area — have there been break-ins, vandalism, or insurance claims at this property in the last 3 years? What carrier currently insures it and at what premium?
- What's the average days-on-market for RENTAL listings here right now (not sales)? A rising rental-DOM trend means longer vacancies and softer asking-rent achievability than the comps imply.
Repairs flagged (vision-AI assessment)
- Major: kitchen cabinets — Broken and severely damaged
- Major: bathroom cabinets — Broken and severely damaged
- Major: interior walls — Peeling paint and debris
- Major: windows — Peeling paint and debris
CashFlowRE · CFR-FB5SF42R95BFMA
· Data 2 days ago
cashflowre.app · 2026-05-29