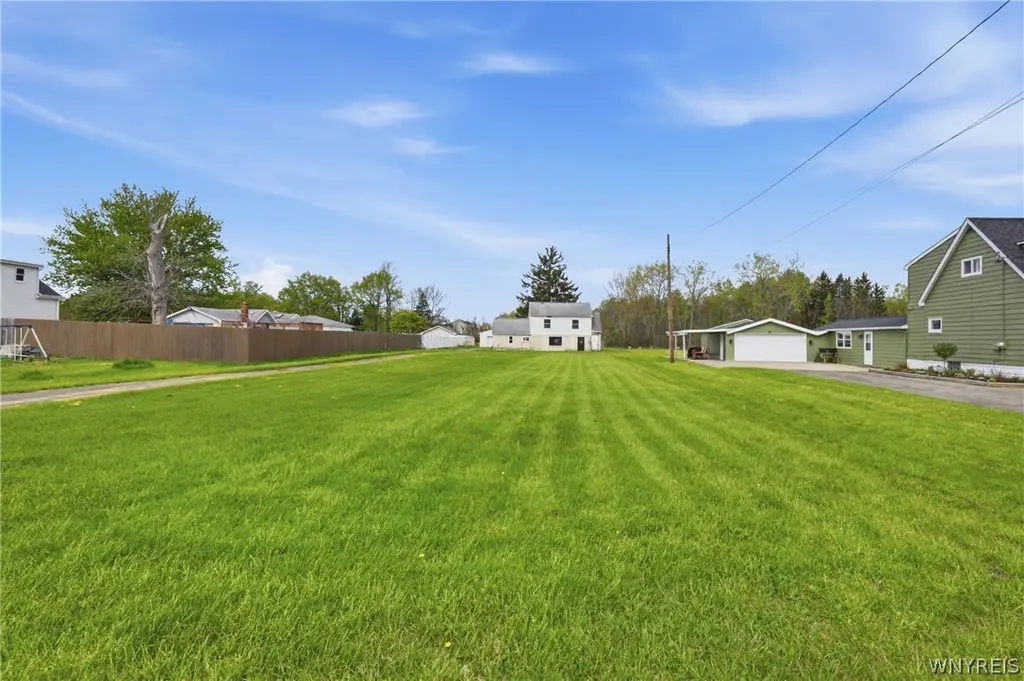
140 Wendel St
Lancaster, NY 14043
$129,900B
3 bd · 1.0 ba ·
1,752 sqft ·
Built 1930
· SingleFamily
· Active
· 31 DOM
Cashflow @ list (25.0% down · 7.5%)
Estimated rent
$1,890/mo
Mortgage (P&I)
−$681
Tax + insurance
−$353
HOA
−$0
Vac / Maint / Mgmt
−$397
Net cashflow
$459/mo
Annual
$5,504/yr
Cap rate
10.53%
Cash-on-cash
15.13%
DSCR
1.67
1% rule
1.46%
Cash to close
$36,372
Investor read
- This is a 3-bed/1.0-bath single-family listed at $130k.
- At list price, monthly cash flow is $459 ($6k/yr) — positive.
- The deal already cash-flows at list — no discount required.
- Meets the 1% rule at list price ($2k rent vs $130k).
- It's been on market 31 days — a 3% lower offer ($126k) is reasonable based on typical stale-listing flexibility.
- Recommended offer: $126k (3.0% below list) — sets the bar for market timing.
- Local home prices are declining (-3.0%/yr); year-one equity from $898 of loan paydown is wiped out by about $4k of value loss. Plan a longer hold.
- Location reads 78/100 on livability (#164 in NY, #2,566 nationally) — a middle-class / working-renter tenant base. Strengths: crime A+, housing A+, health & safety A+; Watch: amenities F, commute F.
- Depew Union Free School District (suburban): math 39% / reading 50% proficiency, ranked #461 of 590 in NY (top 78%) — families likely to look elsewhere, expect single-tenant / working-renter base with shorter leases.
- Watch-outs: property tax is 2.8% of price; built in 1930 — expect roof / HVAC / electrical / plumbing capex.
- Market conditions: Rents rising fast (+5.8%/yr); 124 active listings in the ZIP; 2 comparable units currently listed for rent nearby; 1,244 units permitted in Erie County in 2024 (563 in 5+ unit buildings).
- 11 sale attempts since 10y ago with the ask held roughly flat each time — persistent listings suggest the price (not the market) is what's stuck; bring a comps-based counter.
- Current owner paid $80k; list at $130k implies a 62% gain — meaningful room to come down on a strong offer.
- At projected returns (-3.0% appreciation + 5.8% rent growth), your $36k cash investment doubles in ~7 years — after that, you're playing with house money.
- Cap rate 10.5% vs local median 2.9% in Lancaster — top-decile yield for the area; either an underpriced asset or a hidden risk that comps aren't pricing in. Stress-test before assuming the spread holds.
- This rent runs 31% of the median local income ($74k/yr) — at the standard rent-burdened threshold; future hikes will face affordability resistance.
Questions for listing agent
- It's been on market 31 days. Have you received any prior offers? Is the seller open to a 3% concession, seller financing, or rate buy-down credit?
- Built in 1930 — when were the roof, HVAC, electrical panel, plumbing, and water heater last replaced?
- Property tax is high relative to price — has the assessment been appealed recently, and will the sale trigger a re-assessment?
- Is there a deadline driving the sale (1031 exchange, divorce, estate, relocation)? That informs how much negotiation room exists.
- Schools are A-rated — typically a magnet for longer-tenancy family renters. What's the average tenant stay here, and is there a school-zone premium baked into asking?
- What's the average days-on-market for RENTAL listings here right now (not sales)? A rising rental-DOM trend means longer vacancies and softer asking-rent achievability than the comps imply.
- What's the recent tenant-quality profile in this submarket — average credit score on applications, eviction rate, late-payment / NSF rate, and stable-employment percentage? A property-management company in the area should have these aggregated.
- How much new for-sale + rental construction is in the pipeline within 1–3 miles? Heavy new supply typically softens prices + rents 12–24 months out; constrained supply supports both.
CashFlowRE · CFR-FBVDJEA47SCMMJ
· Data 2 days ago
cashflowre.app · 2026-05-29