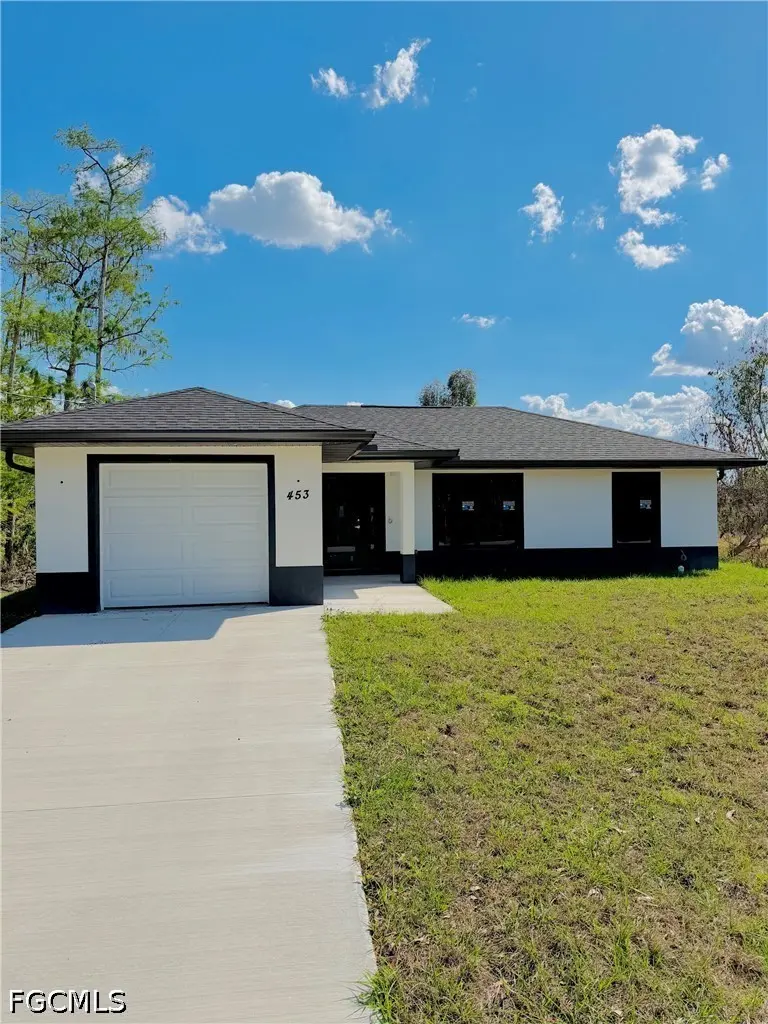
453 Greenbriar Blvd
Lehigh Acres, FL 33972
$289,900F
3 bd · 2.0 ba ·
1,195 sqft ·
Built 2026
· Land
· Active
· 79 DOM
Cashflow @ list (25.0% down · 7.5%)
Estimated rent
$1,691/mo
Mortgage (P&I)
−$1,520
Tax + insurance
−$483
HOA
−$0
Vac / Maint / Mgmt
−$355
Net cashflow
$-668/mo
Annual
$-8,013/yr
Cap rate
3.53%
Cash-on-cash
-9.87%
DSCR
0.56
1% rule
0.58%
Cash to close
$81,172
Investor read
- This is a 3-bed/2.0-bath land listed at $290k.
- At list price, monthly cash flow is $-668 ($-8k/yr) — negative.
- To cash-flow at today's rent, offer at most $193k (33.3% below list).
- To meet the 1% rule (rent ≥ 1% of price), the offer needs to be $169k (41.7% below list).
- It's been on market 79 days — a 6% lower offer ($273k) is reasonable based on typical stale-listing flexibility.
- Recommended offer: $169k (41.7% below list) — sets the bar for 1% rule.
- Local home prices are declining (-3.0%/yr); year-one equity from $2k of loan paydown is wiped out by about $9k of value loss. Plan a longer hold.
- Location reads 59/100 on livability (#826 in FL) — a working-class tenant base; expect higher turnover. Strengths: cost of living A+, housing A+; Watch: crime C-, employment D+, schools D-.
- Lee (suburban): math 47% / reading 50% proficiency, ranked #42 of 73 in FL (top 58%) — families likely to look elsewhere, expect single-tenant / working-renter base with shorter leases.
- Market conditions: Rents rising fast (+5.3%/yr); 1611 active listings in the ZIP; 11 comparable units currently listed for rent nearby; rentals at typical pace (median 25d on market — plan ~3-4 weeks tenant-placement turnaround); 15,411 units permitted in Lee County in 2024 (4,686 in 5+ unit buildings).
- Lee County population projected at +44% by 2050 — long-run rental-demand tailwind backs the buy-and-hold thesis.
- 4 sale attempts since 3y ago with the ask held roughly flat each time — persistent listings suggest the price (not the market) is what's stuck; bring a comps-based counter.
- Current owner paid $17k; list at $290k implies a 1605% gain — meaningful room to come down on a strong offer.
- Climate carrying-cost: severe wind risk, 99% chance of damaging wind over 30y; major wildfire risk; extreme-heat days projected 7→25/yr by 2055 (HVAC capex compounding) — expect insurance premiums to compound above CPI over the hold.
- Cap rate 3.5% vs local median 4.7% in Lehigh Acres — below-typical yield; the buyer is paying a premium for something (appreciation thesis, condition, location) that the cap rate doesn't capture.
Questions for listing agent
- What do current leases actually rent for vs. the listed asking? Can we see a recent rent roll and the last 12 months of T-12 income?
- It's been on market 79 days. Have you received any prior offers? Is the seller open to a 42% concession, seller financing, or rate buy-down credit?
- Why hasn't it sold? Are there any deal-killer items the seller is aware of (foundation, flood, title, zoning, code violations)?
- Is there a deadline driving the sale (1031 exchange, divorce, estate, relocation)? That informs how much negotiation room exists.
- Schools are D-rated, which usually means shorter tenancies and higher turnover. Who's the typical renter profile here, and what's been the actual vacancy rate?
- The area grade is low — what's the realistic commute time and amenity access for the typical tenant pool here? Any planned neighborhood developments (good or bad) we should know about?
- What's the average days-on-market for RENTAL listings here right now (not sales)? A rising rental-DOM trend means longer vacancies and softer asking-rent achievability than the comps imply.
- What's the recent tenant-quality profile in this submarket — average credit score on applications, eviction rate, late-payment / NSF rate, and stable-employment percentage? A property-management company in the area should have these aggregated.
CashFlowRE · CFR-FD9CYC05X3NE0M
· Data 3 days ago
cashflowre.app · 2026-05-29