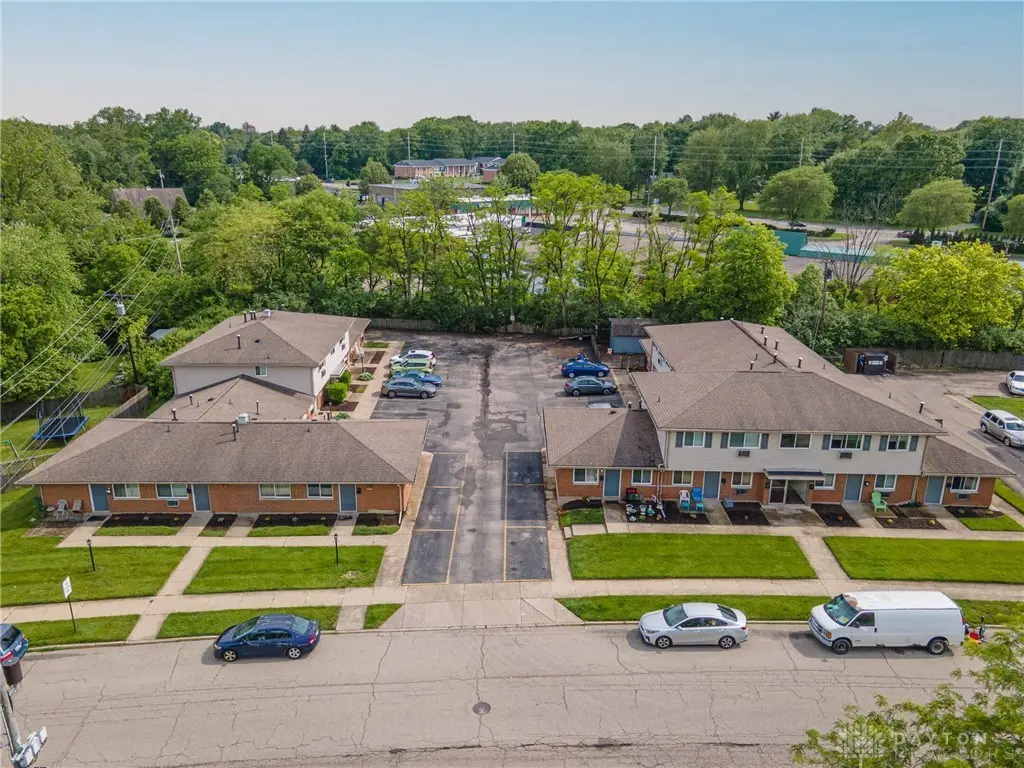
2648 Parklawn Dr
Kettering, OH 45440
$1,949,000B
504 bd · 3.0 ba ·
7,992 sqft ·
Built 1963
· MultiFamily
· Active
· 379 DOM
Cashflow @ list (25.0% down · 7.5%)
Estimated rent
$33,465/mo
Mortgage (P&I)
−$10,221
Tax + insurance
−$1,853
HOA
−$0
Vac / Maint / Mgmt
−$7,028
Net cashflow
$14,364/mo
Annual
$172,364/yr
Cap rate
15.14%
Cash-on-cash
31.58%
DSCR
2.41
1% rule
1.72%
Cash to close
$545,720
Investor read
- This is a 21 × 24-bed/22.0-bath units multifamily listed at $1.95M.
- At list price, monthly cash flow is $14k ($172k/yr) — positive. Per door: $684/mo.
- The deal already cash-flows at list — no discount required.
- Meets the 1% rule at list price ($33k rent vs $1.95M).
- It's been on market 379 days — a 12% lower offer ($1.72M) is reasonable based on typical stale-listing flexibility.
- Recommended offer: $1.72M (12.0% below list) — sets the bar for market timing.
- Local home prices are declining (-3.0%/yr); year-one equity from $13k of loan paydown is wiped out by about $58k of value loss. Plan a longer hold.
- Location reads 83/100 on livability (#61 in OH, #922 nationally) — a professional / high-income tenant draw. Strengths: schools A+, crime A+, cost of living A+; Watch: commute F.
- Kettering City School District (suburban): math 54% / reading 68% proficiency, ranked #277 of 656 in OH (top 42%) — acceptable for families but not a draw, mixed tenant base, ~2y average lease.
- Market conditions: Rents rising fast (+4.3%/yr); 119 active listings in the ZIP; solid renter incomes; 907 units permitted in Montgomery County in 2024 (416 in 5+ unit buildings).
- Montgomery County population projected at -10% by 2050 — secular population decline; favor cash flow + early exit over multi-decade hold.
- Current owner paid $653k; list at $1.95M implies a 198% gain — meaningful room to come down on a strong offer.
- At projected returns (-3.0% appreciation + 4.3% rent growth), your $546k cash investment doubles in ~4 years — after that, you're playing with house money.
- Cap rate 15.1% vs local median 4.4% in Kettering — top-decile yield for the area; either an underpriced asset or a hidden risk that comps aren't pricing in. Stress-test before assuming the spread holds.
- At $33,465/mo this rent would consume 487% of the median local household income ($82k/yr) (locally 626% of renters already pay >50% of income on rent) — very limited rent-growth headroom before tenants either downsize or default.
Questions for listing agent
- It's been on market 379 days. Have you received any prior offers? Is the seller open to a 12% concession, seller financing, or rate buy-down credit?
- Can we see the unit-by-unit rent roll, current vacancy, and any below-market leases? What's the average tenancy length?
- What capital expenditures (roof, boiler, parking lot, exteriors) have been made in the last 5 years, and what's planned in the next 2?
- Built in 1963 — when were the roof, HVAC, electrical panel, plumbing, and water heater last replaced?
- Why hasn't it sold? Are there any deal-killer items the seller is aware of (foundation, flood, title, zoning, code violations)?
- Is there a deadline driving the sale (1031 exchange, divorce, estate, relocation)? That informs how much negotiation room exists.
- Schools are A-rated — typically a magnet for longer-tenancy family renters. What's the average tenant stay here, and is there a school-zone premium baked into asking?
- What's the average days-on-market for RENTAL listings here right now (not sales)? A rising rental-DOM trend means longer vacancies and softer asking-rent achievability than the comps imply.
CashFlowRE · CFR-FDTC4G7NANN1DB
· Data 2 days ago
cashflowre.app · 2026-05-29