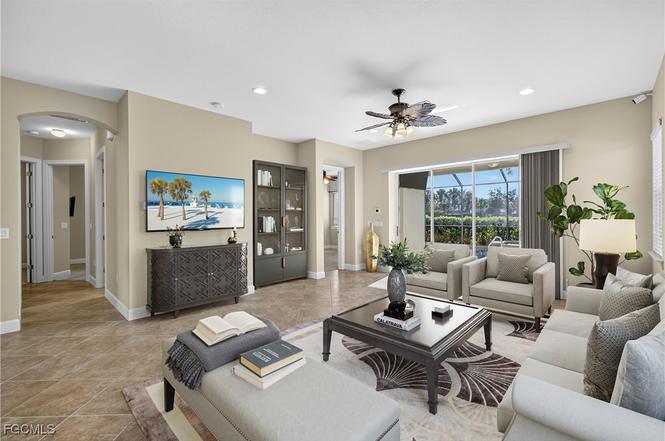
11107 Laughton Cir
Fort Myers, FL 33913
$479,000D-
3 bd · 2.0 ba ·
1,637 sqft ·
Built 2009
· SingleFamily
· Active
· 298 DOM
Cashflow @ list (25.0% down · 7.5%)
Estimated rent
$4,805/mo
Mortgage (P&I)
−$2,512
Tax + insurance
−$983
HOA
−$505
Vac / Maint / Mgmt
−$1,009
Net cashflow
$-204/mo
Annual
$-2,452/yr
Cap rate
5.78%
Cash-on-cash
-1.83%
DSCR
0.92
1% rule
1.00%
Cash to close
$134,120
Investor read
- This is a 3-bed/2.0-bath single-family listed at $479k.
- At list price, monthly cash flow is $-204 ($-2k/yr) — negative.
- To cash-flow at today's rent, offer at most $443k (7.5% below list).
- Meets the 1% rule at list price ($5k rent vs $479k).
- It's been on market 298 days — a 12% lower offer ($422k) is reasonable based on typical stale-listing flexibility.
- Recommended offer: $422k (12.0% below list) — sets the bar for market timing.
- Local home prices are declining (-3.0%/yr); year-one equity from $3k of loan paydown is wiped out by about $14k of value loss. Plan a longer hold.
- Location reads 86/100 on livability (#14 in FL, #383 nationally) — a professional / high-income tenant draw. Strengths: amenities A+, commute A+, housing A+.
- Lee (suburban): math 47% / reading 50% proficiency, ranked #42 of 73 in FL (top 58%) — families likely to look elsewhere, expect single-tenant / working-renter base with shorter leases.
- Market conditions: Rents flat; 811 active listings in the ZIP; 40 comparable units currently listed for rent nearby; rentals at typical pace (median 24d on market — plan ~3-4 weeks tenant-placement turnaround); high-income renter base; 15,411 units permitted in Lee County in 2024 (4,686 in 5+ unit buildings).
- Lee County population projected at +44% by 2050 — long-run rental-demand tailwind backs the buy-and-hold thesis.
- 2 sale attempts; this cycle's ask has dropped $46k (9%) from the opening price — seller is motivated, your offer sets the floor, not the list.
- Climate carrying-cost: severe wind risk, 99% chance of damaging wind over 30y; extreme-heat days projected 7→28/yr by 2055 (HVAC capex compounding) — expect insurance premiums to compound above CPI over the hold.
- Cap rate 5.8% vs local median 3.0% in Fort Myers — top-decile yield for the area; either an underpriced asset or a hidden risk that comps aren't pricing in. Stress-test before assuming the spread holds.
- At $4,805/mo this rent would consume 52% of the median local household income ($110k/yr) (locally 276% of renters already pay >50% of income on rent) — very limited rent-growth headroom before tenants either downsize or default.
Questions for listing agent
- What do current leases actually rent for vs. the listed asking? Can we see a recent rent roll and the last 12 months of T-12 income?
- It's been on market 298 days. Have you received any prior offers? Is the seller open to a 12% concession, seller financing, or rate buy-down credit?
- What does the HOA fee cover, when was the last increase, and are there any pending special assessments or reserve-fund shortfalls?
- Why hasn't it sold? Are there any deal-killer items the seller is aware of (foundation, flood, title, zoning, code violations)?
- Is there a deadline driving the sale (1031 exchange, divorce, estate, relocation)? That informs how much negotiation room exists.
- The area grade is low — what's the realistic commute time and amenity access for the typical tenant pool here? Any planned neighborhood developments (good or bad) we should know about?
- What's the average days-on-market for RENTAL listings here right now (not sales)? A rising rental-DOM trend means longer vacancies and softer asking-rent achievability than the comps imply.
- What's the recent tenant-quality profile in this submarket — average credit score on applications, eviction rate, late-payment / NSF rate, and stable-employment percentage? A property-management company in the area should have these aggregated.
CashFlowRE · CFR-FEQZB6DCW0BGAJ
· Data 3 days ago
cashflowre.app · 2026-05-29