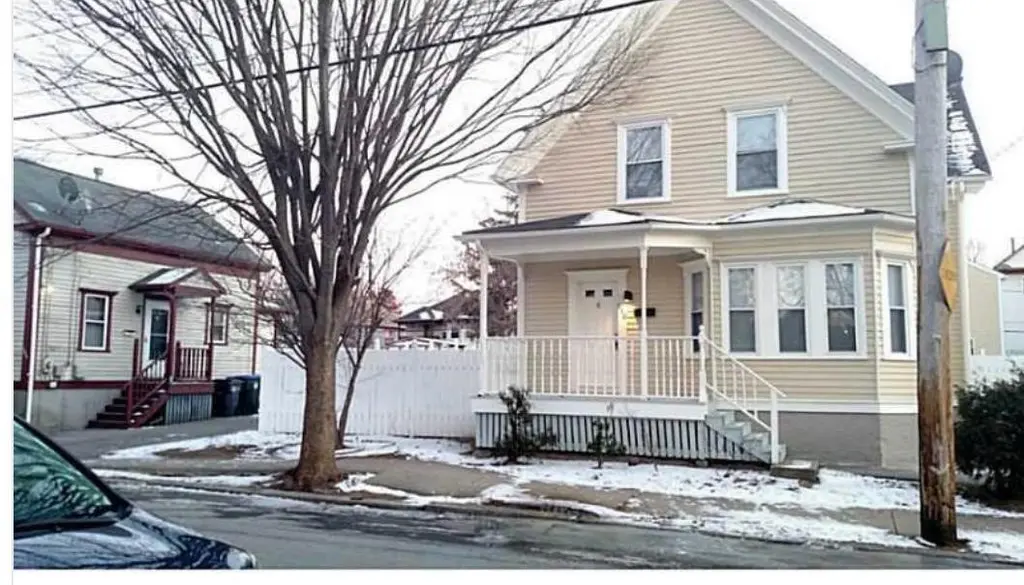
110 Gallup St
Providence, RI 02905
$395,000D
5 bd · 3.0 ba ·
1,173 sqft ·
Built 1945
· SingleFamily
· Pending
· 57 DOM
Cashflow @ list (25.0% down · 7.5%)
Estimated rent
$2,950/mo
Mortgage (P&I)
−$2,071
Tax + insurance
−$429
HOA
−$0
Vac / Maint / Mgmt
−$619
Net cashflow
$-170/mo
Annual
$-2,046/yr
Cap rate
5.78%
Cash-on-cash
-1.85%
DSCR
0.92
1% rule
0.75%
Cash to close
$110,600
Investor read
- This is a 5-bed/3.0-bath single-family listed at $395k.
- At list price, monthly cash flow is $-170 ($-2k/yr) — negative.
- To cash-flow at today's rent, offer at most $365k (7.6% below list).
- To meet the 1% rule (rent ≥ 1% of price), the offer needs to be $295k (25.3% below list).
- It's been on market 57 days — a 3% lower offer ($383k) is reasonable based on typical stale-listing flexibility.
- Recommended offer: $295k (25.3% below list) — sets the bar for 1% rule.
- Local home prices are declining (-3.0%/yr); year-one equity from $3k of loan paydown is wiped out by about $12k of value loss. Plan a longer hold.
- Location reads 84/100 on livability (#2 in RI, #794 nationally) — a professional / high-income tenant draw. Strengths: amenities A+, commute A+, housing A+; Watch: employment C-, schools F.
- Providence (urban): math 8% / reading 16% proficiency, ranked #34 of 39 in RI (top 87%) — low school quality limits family demand, transient renter base, plan for 1-2y turnover; 79% free/reduced lunch — lower-income household profile, screen leases tightly.
- Watch-outs: built in 1945 — expect roof / HVAC / electrical / plumbing capex.
- Market conditions: Rents rising (+3.5%/yr); 75 active listings in the ZIP; 776 units permitted in Providence County in 2024 (229 in 5+ unit buildings).
- Providence County population projected at +5% by 2050 — modest demand growth; plan on rents tracking national, not racing it.
- 8 sale attempts since 12y ago with the ask held roughly flat each time — persistent listings suggest the price (not the market) is what's stuck; bring a comps-based counter.
- Current owner paid $172k; list at $395k implies a 130% gain — meaningful room to come down on a strong offer.
- Climate carrying-cost: major wind risk, 74% chance of damaging wind over 30y; extreme-heat days projected 7→15/yr by 2055 (HVAC capex compounding) — expect insurance premiums to compound above CPI over the hold.
- Cap rate 5.8% vs local median 4.2% in Providence — top-decile yield for the area; either an underpriced asset or a hidden risk that comps aren't pricing in. Stress-test before assuming the spread holds.
- At $2,950/mo this rent would consume 56% of the median local household income ($63k/yr) (locally 1220% of renters already pay >50% of income on rent) — very limited rent-growth headroom before tenants either downsize or default.
Questions for listing agent
- What do current leases actually rent for vs. the listed asking? Can we see a recent rent roll and the last 12 months of T-12 income?
- It's been on market 57 days. Have you received any prior offers? Is the seller open to a 25% concession, seller financing, or rate buy-down credit?
- Built in 1945 — when were the roof, HVAC, electrical panel, plumbing, and water heater last replaced?
- Is there a deadline driving the sale (1031 exchange, divorce, estate, relocation)? That informs how much negotiation room exists.
- Schools are F-rated, which usually means shorter tenancies and higher turnover. Who's the typical renter profile here, and what's been the actual vacancy rate?
- The area grade is low — what's the realistic commute time and amenity access for the typical tenant pool here? Any planned neighborhood developments (good or bad) we should know about?
- What's the average days-on-market for RENTAL listings here right now (not sales)? A rising rental-DOM trend means longer vacancies and softer asking-rent achievability than the comps imply.
- What's the recent tenant-quality profile in this submarket — average credit score on applications, eviction rate, late-payment / NSF rate, and stable-employment percentage? A property-management company in the area should have these aggregated.
CashFlowRE · CFR-FH5ABRFZRZ6FA3
· Data 3 weeks ago
cashflowre.app · 2026-05-29