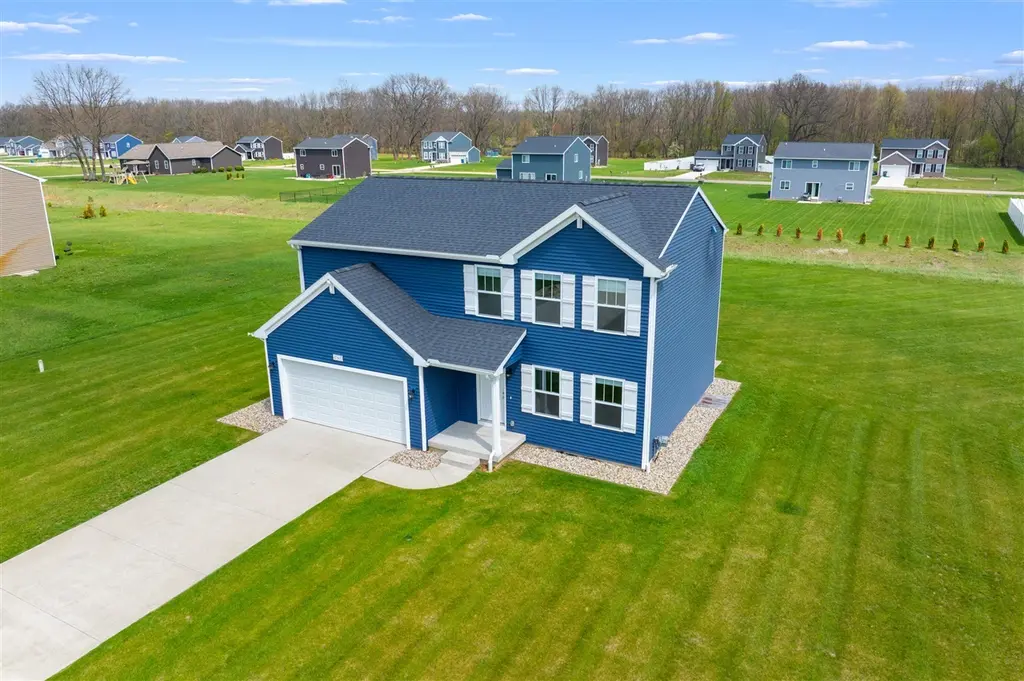
47805 Silver Oaks West W
Mattawan, MI 49071
$329,000D
4 bd · 2.5 ba ·
1,800 sqft ·
Built 2021
· SingleFamily
· Pending
· 10 DOM
Cashflow @ list (25.0% down · 7.5%)
Estimated rent
$2,600/mo
Mortgage (P&I)
−$1,725
Tax + insurance
−$548
HOA
−$23
Vac / Maint / Mgmt
−$546
Net cashflow
$-243/mo
Annual
$-2,912/yr
Cap rate
5.41%
Cash-on-cash
-3.16%
DSCR
0.86
1% rule
0.79%
Cash to close
$92,120
Investor read
- This is a 4-bed/2.5-bath single-family listed at $329k.
- At list price, monthly cash flow is $-243 ($-3k/yr) — negative.
- To cash-flow at today's rent, offer at most $294k (10.7% below list).
- To meet the 1% rule (rent ≥ 1% of price), the offer needs to be $260k (21.0% below list).
- Only 10 days on market — expect competitive offers; lowballing is unlikely to land.
- Recommended offer: $260k (21.0% below list) — sets the bar for 1% rule.
- Local home prices are declining (-3.0%/yr); year-one equity from $2k of loan paydown is wiped out by about $10k of value loss. Plan a longer hold.
- Location reads 72/100 on livability (#235 in MI) — a middle-class / working-renter tenant base. Strengths: cost of living A+, housing A+, health & safety A-; Watch: crime D, amenities F, commute F.
- Paw Paw Public School District (town): math 34% / reading 55% proficiency, ranked #145 of 540 in MI (top 27%) — families likely to look elsewhere, expect single-tenant / working-renter base with shorter leases.
- Zoned schools: Paw Paw Early Elementary School (472 students, 46% FRL); Paw Paw Middle School (math 37% / reading 41%, grade F, #223 of 493 statewide, top 46%, 475 students, 42% FRL); Paw Paw High School (math 31% / reading 71%, grade D+, #142 of 713 statewide, top 20%, 692 students, 33% FRL) — zoned schools at 40% FRL track the district average.
- Market conditions: 159 active listings in the ZIP; 1 comparable units currently listed for rent nearby; 165 units permitted in Van Buren County in 2024 (0 in 5+ unit buildings).
- Van Buren County population projected at -23% by 2050 — secular population decline; favor cash flow + early exit over multi-decade hold.
- 17 sale attempts since 5y ago with the ask held roughly flat each time — persistent listings suggest the price (not the market) is what's stuck; bring a comps-based counter.
- Cap rate 5.4% vs local median 2.4% in Mattawan — top-decile yield for the area; either an underpriced asset or a hidden risk that comps aren't pricing in. Stress-test before assuming the spread holds.
Questions for listing agent
- What do current leases actually rent for vs. the listed asking? Can we see a recent rent roll and the last 12 months of T-12 income?
- What does the HOA fee cover, when was the last increase, and are there any pending special assessments or reserve-fund shortfalls?
- Is there a deadline driving the sale (1031 exchange, divorce, estate, relocation)? That informs how much negotiation room exists.
- Schools are B-rated — typically a magnet for longer-tenancy family renters. What's the average tenant stay here, and is there a school-zone premium baked into asking?
- Crime grade is D in this area — have there been break-ins, vandalism, or insurance claims at this property in the last 3 years? What carrier currently insures it and at what premium?
- The area grade is low — what's the realistic commute time and amenity access for the typical tenant pool here? Any planned neighborhood developments (good or bad) we should know about?
- What's the average days-on-market for RENTAL listings here right now (not sales)? A rising rental-DOM trend means longer vacancies and softer asking-rent achievability than the comps imply.
- What's the recent tenant-quality profile in this submarket — average credit score on applications, eviction rate, late-payment / NSF rate, and stable-employment percentage? A property-management company in the area should have these aggregated.
CashFlowRE · CFR-FJ95XBBMTY9W13
· Data 3 weeks ago
cashflowre.app · 2026-05-29