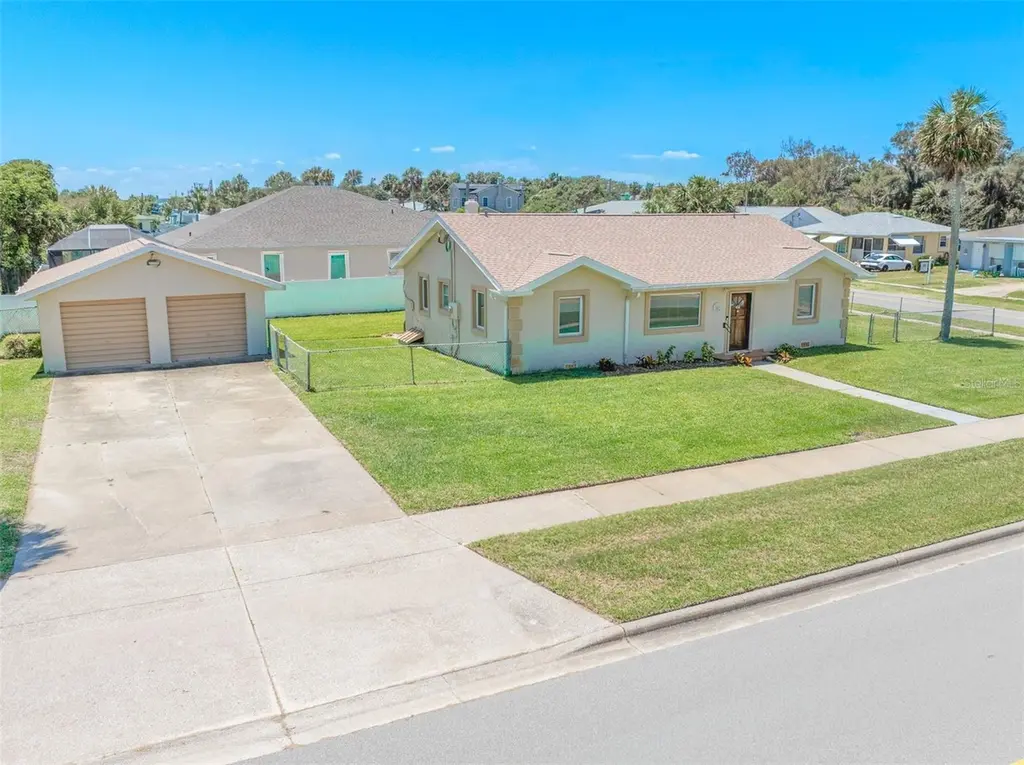
402 Seaview Ave
Daytona Beach, FL 32118
$399,900D-
4 bd · 2.0 ba ·
1,452 sqft ·
Built 1952
· SingleFamily
· Active
· 11 DOM
Cashflow @ list (25.0% down · 7.5%)
Estimated rent
$2,811/mo
Mortgage (P&I)
−$2,097
Tax + insurance
−$336
HOA
−$0
Vac / Maint / Mgmt
−$590
Net cashflow
$-213/mo
Annual
$-2,554/yr
Cap rate
5.85%
Cash-on-cash
-1.57%
DSCR
0.93
1% rule
0.70%
Cash to close
$111,972
Investor read
- This is a 4-bed/2.0-bath single-family listed at $400k.
- At list price, monthly cash flow is $-213 ($-3k/yr) — negative.
- To cash-flow at today's rent, offer at most $362k (9.4% below list).
- To meet the 1% rule (rent ≥ 1% of price), the offer needs to be $281k (29.7% below list).
- Only 11 days on market — expect competitive offers; lowballing is unlikely to land.
- Recommended offer: $281k (29.7% below list) — sets the bar for 1% rule.
- Local home prices are declining (-3.0%/yr); year-one equity from $3k of loan paydown is wiped out by about $12k of value loss. Plan a longer hold.
- Location reads 83/100 on livability (#46 in FL, #867 nationally) — a professional / high-income tenant draw. Strengths: amenities A+, commute A+, cost of living A+; Watch: employment D-.
- Volusia (suburban): math 44% / reading 49% proficiency, ranked #47 of 73 in FL (top 64%) — families likely to look elsewhere, expect single-tenant / working-renter base with shorter leases.
- Zoned schools: Campbell Middle School (math 28% / reading 30%, grade F, #479 of 571 statewide, top 84%, 855 students, 80% FRL); Seabreeze High School (math 31% / reading 56%, grade F, #248 of 667 statewide, top 38%, 1,654 students, 41% FRL).
- Watch-outs: flood insurance adds $66/mo; built in 1952 — expect roof / HVAC / electrical / plumbing capex.
- Market conditions: Rents soft (-0.2%/yr); 923 active listings in the ZIP; 2 comparable units currently listed for rent nearby; 3,402 units permitted in Volusia County in 2024 (681 in 5+ unit buildings).
- Volusia County population projected at +19% by 2050 — long-run rental-demand tailwind backs the buy-and-hold thesis.
- 2 sale attempts with the ask held roughly flat each time — persistent listings suggest the price (not the market) is what's stuck; bring a comps-based counter.
- Current owner paid $70k; list at $400k implies a 471% gain — meaningful room to come down on a strong offer.
- Climate carrying-cost: major flood risk; severe wind risk, 99% chance of damaging wind over 30y; extreme-heat days projected 7→20/yr by 2055 (HVAC capex compounding) — expect insurance premiums to compound above CPI over the hold.
- At $2,811/mo this rent would consume 55% of the median local household income ($61k/yr) (locally 937% of renters already pay >50% of income on rent) — very limited rent-growth headroom before tenants either downsize or default.
Questions for listing agent
- What do current leases actually rent for vs. the listed asking? Can we see a recent rent roll and the last 12 months of T-12 income?
- Built in 1952 — when were the roof, HVAC, electrical panel, plumbing, and water heater last replaced?
- What's the actual annual flood-insurance premium (NFIP or private), and is the property in a SFHA with mandatory coverage?
- Is there a deadline driving the sale (1031 exchange, divorce, estate, relocation)? That informs how much negotiation room exists.
- Schools are D-rated, which usually means shorter tenancies and higher turnover. Who's the typical renter profile here, and what's been the actual vacancy rate?
- The area grade is low — what's the realistic commute time and amenity access for the typical tenant pool here? Any planned neighborhood developments (good or bad) we should know about?
- What's the average days-on-market for RENTAL listings here right now (not sales)? A rising rental-DOM trend means longer vacancies and softer asking-rent achievability than the comps imply.
- What's the recent tenant-quality profile in this submarket — average credit score on applications, eviction rate, late-payment / NSF rate, and stable-employment percentage? A property-management company in the area should have these aggregated.
CashFlowRE · CFR-FJTKGS84EFH64S
· Data 12 h ago
cashflowre.app · 2026-05-29