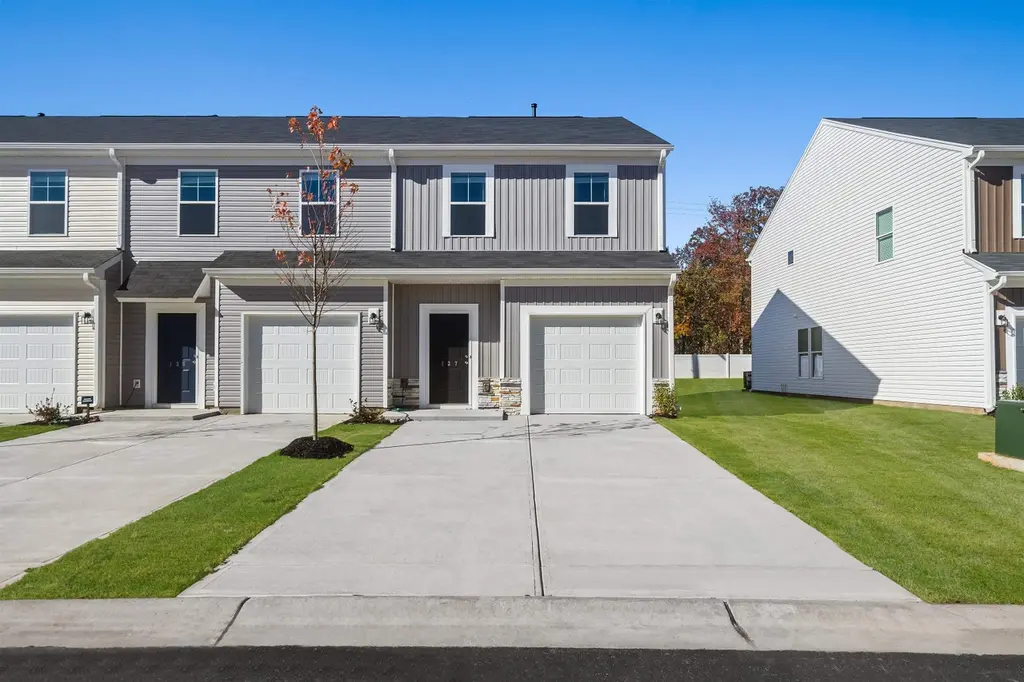
188 Randwick Ln
Greer, SC 29651
$234,195D-
3 bd · 2.5 ba ·
1,470 sqft ·
Built 2026
· Townhouse
· Active
· 42 DOM
Cashflow @ list (25.0% down · 7.5%)
Estimated rent
$1,849/mo
Mortgage (P&I)
−$1,228
Tax + insurance
−$151
HOA
−$163
Vac / Maint / Mgmt
−$388
Net cashflow
$-82/mo
Annual
$-984/yr
Cap rate
5.87%
Cash-on-cash
-1.50%
DSCR
0.93
1% rule
0.79%
Cash to close
$65,575
Investor read
- This is a 3-bed/2.5-bath townhouse listed at $234k. Condition is rated good.
- At list price, monthly cash flow is $-82 ($-984/yr) — negative.
- To cash-flow at today's rent, offer at most $220k (6.2% below list).
- To meet the 1% rule (rent ≥ 1% of price), the offer needs to be $185k (21.1% below list).
- It's been on market 42 days — a 3% lower offer ($227k) is reasonable based on typical stale-listing flexibility.
- Recommended offer: $185k (21.1% below list) — sets the bar for 1% rule.
- Local home prices are declining (-3.0%/yr); year-one equity from $2k of loan paydown is wiped out by about $7k of value loss. Plan a longer hold.
- Location reads 81/100 on livability (#7 in SC, #1,463 nationally) — a professional / high-income tenant draw. Strengths: amenities A+, cost of living A+, housing A+; Watch: crime C-, commute F.
- Spartanburg 05 (suburban): math 45% / reading 51% proficiency, ranked #13 of 80 in SC (top 16%) — families likely to look elsewhere, expect single-tenant / working-renter base with shorter leases.
- Zoned schools: Abner Creek Academy (math 60% / reading 57%, grade B-, #95 of 597 statewide, top 16%, 752 students, 55% FRL) — zoned schools average 55% FRL vs 39% district-wide (15 pts higher); higher-poverty schools than district average — tighter screening recommended.
- Market conditions: Rents rising (+1.6%/yr); 503 active listings in the ZIP; 8 comparable units currently listed for rent nearby; rentals leasing fast (median 14d on market — plan ~1-2 weeks tenant-placement turnaround); solid renter incomes; 3,129 units permitted in Spartanburg County in 2024 (40 in 5+ unit buildings).
- Spartanburg County population projected at +18% by 2050 — long-run rental-demand tailwind backs the buy-and-hold thesis.
- 2 sale attempts with the ask held roughly flat each time — persistent listings suggest the price (not the market) is what's stuck; bring a comps-based counter.
- Cap rate 5.9% vs local median 3.2% in Greer — top-decile yield for the area; either an underpriced asset or a hidden risk that comps aren't pricing in. Stress-test before assuming the spread holds.
Questions for listing agent
- What do current leases actually rent for vs. the listed asking? Can we see a recent rent roll and the last 12 months of T-12 income?
- It's been on market 42 days. Have you received any prior offers? Is the seller open to a 21% concession, seller financing, or rate buy-down credit?
- What does the HOA fee cover, when was the last increase, and are there any pending special assessments or reserve-fund shortfalls?
- Is there a deadline driving the sale (1031 exchange, divorce, estate, relocation)? That informs how much negotiation room exists.
- Schools are B-rated — typically a magnet for longer-tenancy family renters. What's the average tenant stay here, and is there a school-zone premium baked into asking?
- The area grade is low — what's the realistic commute time and amenity access for the typical tenant pool here? Any planned neighborhood developments (good or bad) we should know about?
- What's the average days-on-market for RENTAL listings here right now (not sales)? A rising rental-DOM trend means longer vacancies and softer asking-rent achievability than the comps imply.
- What's the recent tenant-quality profile in this submarket — average credit score on applications, eviction rate, late-payment / NSF rate, and stable-employment percentage? A property-management company in the area should have these aggregated.
CashFlowRE · CFR-FJVHSFF7T7NG1C
· Data 2 days ago
cashflowre.app · 2026-05-29