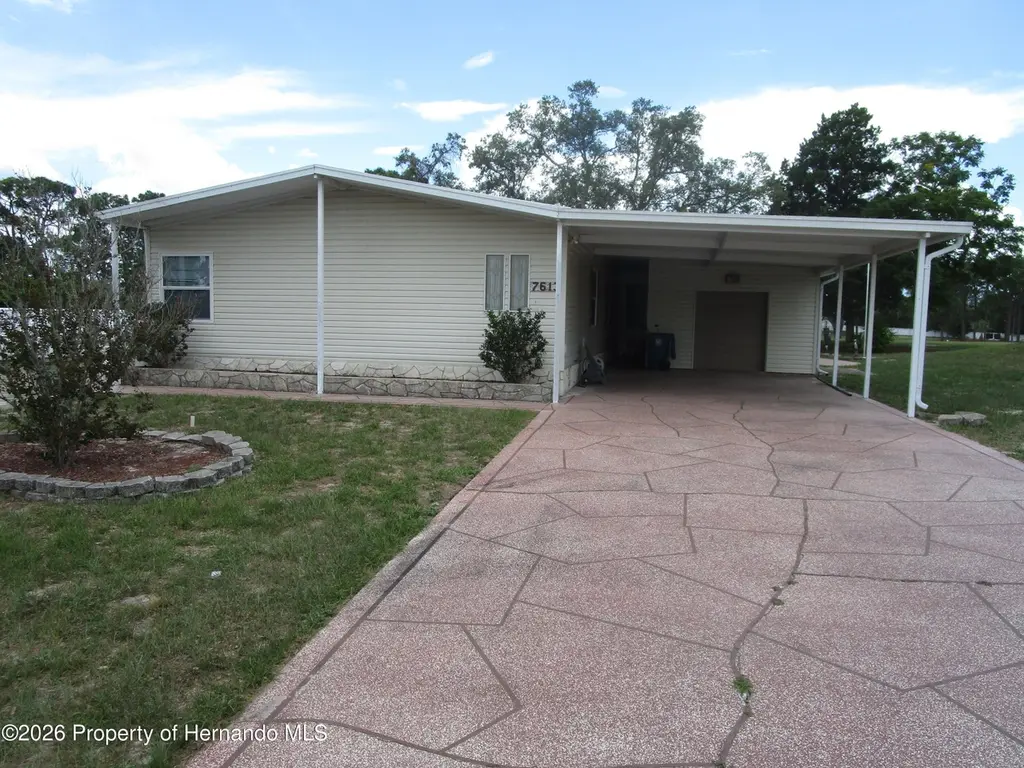
7613 Moriah Ave #6
Brookridge, FL 34613
$180,000B-
3 bd · 2.0 ba ·
1,792 sqft ·
Built 1992
· Manufactured
· Active
· 6 DOM
Cashflow @ list (25.0% down · 7.5%)
Estimated rent
$2,206/mo
Mortgage (P&I)
−$944
Tax + insurance
−$300
HOA
−$55
Vac / Maint / Mgmt
−$463
Net cashflow
$444/mo
Annual
$5,326/yr
Cap rate
9.25%
Cash-on-cash
10.57%
DSCR
1.47
1% rule
1.23%
Cash to close
$50,400
Investor read
- This is a 3-bed/2.0-bath manufactured listed at $180k. Condition is rated average.
- At list price, monthly cash flow is $444 ($5k/yr) — positive.
- The deal already cash-flows at list — no discount required.
- Meets the 1% rule at list price ($2k rent vs $180k).
- Only 6 days on market — expect competitive offers; lowballing is unlikely to land.
- Local home prices are declining (-3.0%/yr); year-one equity from $1k of loan paydown is wiped out by about $5k of value loss. Plan a longer hold.
- Location reads 70/100 on livability (#421 in FL) — a middle-class / working-renter tenant base. Strengths: cost of living A+, housing A+, crime B+; Watch: employment C-, health & safety C-, amenities F.
- Hernando (suburban): math 50% / reading 50% proficiency, ranked #38 of 73 in FL (top 52%) — acceptable for families but not a draw, mixed tenant base, ~2y average lease.
- Zoned schools: Pine Grove Elementary School (math 60% / reading 45%, grade C-, #976 of 2,144 statewide, top 46%, 991 students, 60% FRL); West Hernando Middle School (math 36% / reading 37%, grade F, #405 of 571 statewide, top 72%, 695 students, 58% FRL); Central High School (math 34% / reading 44%, grade F, #312 of 667 statewide, top 48%, 1,426 students, 53% FRL) — zoned schools at 57% FRL track the district average.
- Market conditions: 691 active listings in the ZIP; 9 comparable units currently listed for rent nearby; rentals leasing fast (median 6d on market — plan ~1-2 weeks tenant-placement turnaround); 2,505 units permitted in Hernando County in 2024 (318 in 5+ unit buildings).
- Hernando County population projected at +11% by 2050 — modest demand growth; plan on rents tracking national, not racing it.
- Climate carrying-cost: severe wind risk, 99% chance of damaging wind over 30y; extreme-heat days projected 7→26/yr by 2055 (HVAC capex compounding) — expect insurance premiums to compound above CPI over the hold.
- Cap rate 9.3% vs local median 6.3% in Brookridge — top-decile yield for the area; either an underpriced asset or a hidden risk that comps aren't pricing in. Stress-test before assuming the spread holds.
- At $2,206/mo this rent would consume 45% of the median local household income ($59k/yr) (locally 307% of renters already pay >50% of income on rent) — very limited rent-growth headroom before tenants either downsize or default.
Questions for listing agent
- What does the HOA fee cover, when was the last increase, and are there any pending special assessments or reserve-fund shortfalls?
- Is there a deadline driving the sale (1031 exchange, divorce, estate, relocation)? That informs how much negotiation room exists.
- Schools are F-rated, which usually means shorter tenancies and higher turnover. Who's the typical renter profile here, and what's been the actual vacancy rate?
- What's the average days-on-market for RENTAL listings here right now (not sales)? A rising rental-DOM trend means longer vacancies and softer asking-rent achievability than the comps imply.
- What's the recent tenant-quality profile in this submarket — average credit score on applications, eviction rate, late-payment / NSF rate, and stable-employment percentage? A property-management company in the area should have these aggregated.
- How much new for-sale + rental construction is in the pipeline within 1–3 miles? Heavy new supply typically softens prices + rents 12–24 months out; constrained supply supports both.
Repairs flagged (vision-AI assessment)
- Moderate: kitchen cabinets — dated and in need of updating
- Moderate: bathroom fixtures — outdated and in need of replacement
- Minor: exterior siding — moderate wear
CashFlowRE · CFR-FMF0XCEK9G27VN
· Data 3 days ago
cashflowre.app · 2026-05-29