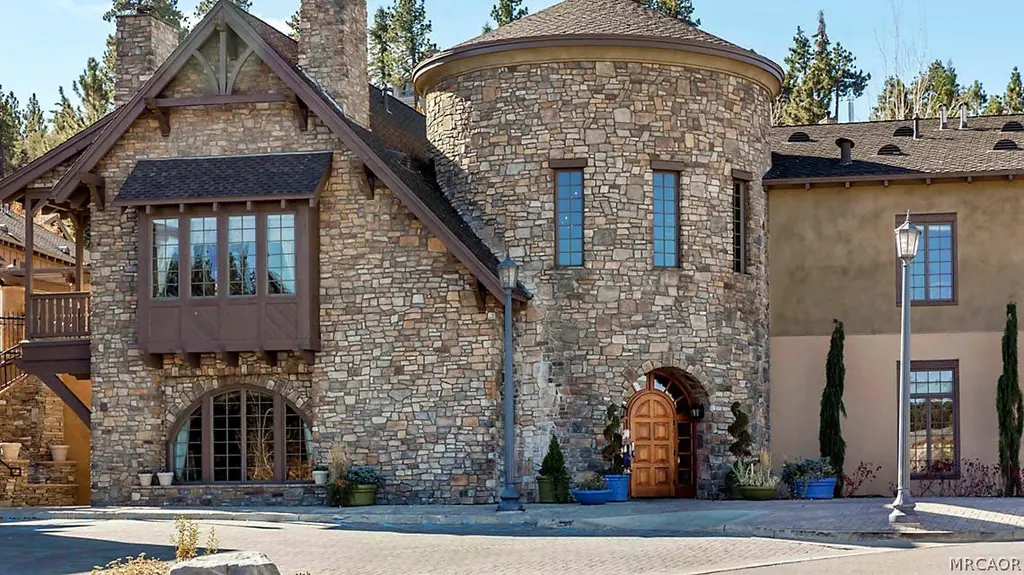
40671 Village Dr Unit 15B
Big Bear Lake, CA 92315
$5,000D
4 bd · 4.0 ba ·
2,880 sqft ·
Built 2002
· Timeshare
· Active
· 79 DOM
Cashflow @ list (25.0% down · 7.5%)
Estimated rent
$3,480/mo
Mortgage (P&I)
−$26
Tax + insurance
−$8
HOA
−$1,369
Vac / Maint / Mgmt
−$731
Net cashflow
$1,346/mo
Annual
$16,152/yr
Cap rate
329.34%
Cash-on-cash
1153.74%
DSCR
52.34
1% rule
69.61%
Cash to close
$1,400
Investor read
- This is a 4-bed/4.0-bath timeshare listed at $5k.
- At list price, monthly cash flow is $1k ($16k/yr) — positive.
- The deal already cash-flows at list — no discount required.
- Meets the 1% rule at list price ($3k rent vs $5k).
- It's been on market 79 days — a 6% lower offer ($5k) is reasonable based on typical stale-listing flexibility.
- Recommended offer: $5k (6.0% below list) — sets the bar for market timing.
- Local home prices are declining (-3.0%/yr); year-one equity from $35 of loan paydown is wiped out by about $150 of value loss. Plan a longer hold.
- Location reads 64/100 on livability (#420 in CA) — a middle-class / working-renter tenant base. Strengths: commute A+; Watch: crime C-, housing C-, health & safety D+.
- Bear Valley Unified (town): math 26% / reading 43% proficiency, ranked #289 of 517 in CA (top 56%) — families likely to look elsewhere, expect single-tenant / working-renter base with shorter leases.
- Watch-outs: HOA is 39% of rent.
- Market conditions: Rents falling (-3.5%/yr); 528 active listings in the ZIP; 2 comparable units currently listed for rent nearby; solid renter incomes; 5,458 units permitted in San Bernardino County in 2024 (1,500 in 5+ unit buildings).
- San Bernardino County population projected at +15% by 2050 — modest demand growth; plan on rents tracking national, not racing it.
- 9 sale attempts since 13y ago with the ask held roughly flat each time — persistent listings suggest the price (not the market) is what's stuck; bring a comps-based counter.
- At projected returns (-3.0% appreciation + 0.0% rent growth), your $1k cash investment doubles in ~1 year — after that, you're playing with house money.
- Cap rate 329.3% vs local median 2.4% in Big Bear Lake — top-decile yield for the area; either an underpriced asset or a hidden risk that comps aren't pricing in. Stress-test before assuming the spread holds.
- At $3,480/mo this rent would consume 54% of the median local household income ($77k/yr) (locally 209% of renters already pay >50% of income on rent) — very limited rent-growth headroom before tenants either downsize or default.
Questions for listing agent
- It's been on market 79 days. Have you received any prior offers? Is the seller open to a 6% concession, seller financing, or rate buy-down credit?
- What does the HOA fee cover, when was the last increase, and are there any pending special assessments or reserve-fund shortfalls?
- Why hasn't it sold? Are there any deal-killer items the seller is aware of (foundation, flood, title, zoning, code violations)?
- Is there a deadline driving the sale (1031 exchange, divorce, estate, relocation)? That informs how much negotiation room exists.
- Schools are D-rated, which usually means shorter tenancies and higher turnover. Who's the typical renter profile here, and what's been the actual vacancy rate?
- The area grade is low — what's the realistic commute time and amenity access for the typical tenant pool here? Any planned neighborhood developments (good or bad) we should know about?
- What's the average days-on-market for RENTAL listings here right now (not sales)? A rising rental-DOM trend means longer vacancies and softer asking-rent achievability than the comps imply.
- What's the recent tenant-quality profile in this submarket — average credit score on applications, eviction rate, late-payment / NSF rate, and stable-employment percentage? A property-management company in the area should have these aggregated.
CashFlowRE · CFR-FP9SYS78W41F7G
· Data 2 days ago
cashflowre.app · 2026-05-29