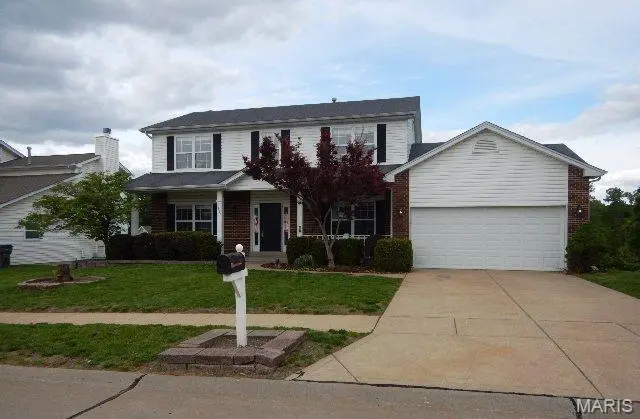
3335 Hampton Xing
St. Peters, MO 63303
$324,750D-
4 bd · 3.5 ba ·
3,125 sqft ·
Built 2002
· SingleFamily
· Pending
· 12 DOM
Cashflow @ list (25.0% down · 7.5%)
Estimated rent
$2,203/mo
Mortgage (P&I)
−$1,703
Tax + insurance
−$467
HOA
−$17
Vac / Maint / Mgmt
−$463
Net cashflow
$-447/mo
Annual
$-5,363/yr
Cap rate
4.64%
Cash-on-cash
-5.90%
DSCR
0.74
1% rule
0.68%
Cash to close
$90,930
Investor read
- This is a 4-bed/3.5-bath single-family listed at $325k.
- At list price, monthly cash flow is $-447 ($-5k/yr) — negative.
- To cash-flow at today's rent, offer at most $246k (24.3% below list).
- To meet the 1% rule (rent ≥ 1% of price), the offer needs to be $220k (32.2% below list).
- Only 12 days on market — expect competitive offers; lowballing is unlikely to land.
- Recommended offer: $220k (32.2% below list) — sets the bar for 1% rule.
- Local home prices are declining (-3.0%/yr); year-one equity from $2k of loan paydown is wiped out by about $10k of value loss. Plan a longer hold.
- Location reads: area grade D — affects rentability + tenant quality, not the cash-flow math above.
- Francis Howell R-III (suburban): math 53% / reading 63% proficiency, ranked #11 of 324 in MO (top 3%) — acceptable for families but not a draw, mixed tenant base, ~2y average lease; only 15% free/reduced lunch — higher-income household profile.
- Zoned schools: Becky-David Elem. (math 62% / reading 71%, grade B+, #57 of 1,115 statewide, top 5%, 849 students, 13% FRL); Francis Howell North High (math 40% / reading 55%, grade D, #154 of 521 statewide, top 29%, 1,679 students, 19% FRL) — zoned schools at 16% FRL track the district average.
- Market conditions: Rents rising (+3.3%/yr); 192 active listings in the ZIP; 1 comparable units currently listed for rent nearby; solid renter incomes; 2,021 units permitted in St. Charles County in 2024 (568 in 5+ unit buildings).
- St. Charles County population projected at +22% by 2050 — long-run rental-demand tailwind backs the buy-and-hold thesis.
- 2 sale attempts since 8y ago with the ask held roughly flat each time — persistent listings suggest the price (not the market) is what's stuck; bring a comps-based counter.
- Current owner paid $275k; 18% above their basis — modest negotiation headroom, anchor on the comps not their cost.
- Climate carrying-cost: extreme-heat days projected 7→20/yr by 2055 (HVAC capex compounding) — expect insurance premiums to compound above CPI over the hold.
Questions for listing agent
- What do current leases actually rent for vs. the listed asking? Can we see a recent rent roll and the last 12 months of T-12 income?
- What does the HOA fee cover, when was the last increase, and are there any pending special assessments or reserve-fund shortfalls?
- Is there a deadline driving the sale (1031 exchange, divorce, estate, relocation)? That informs how much negotiation room exists.
- The area grade is low — what's the realistic commute time and amenity access for the typical tenant pool here? Any planned neighborhood developments (good or bad) we should know about?
- What's the average days-on-market for RENTAL listings here right now (not sales)? A rising rental-DOM trend means longer vacancies and softer asking-rent achievability than the comps imply.
- What's the recent tenant-quality profile in this submarket — average credit score on applications, eviction rate, late-payment / NSF rate, and stable-employment percentage? A property-management company in the area should have these aggregated.
- How much new for-sale + rental construction is in the pipeline within 1–3 miles? Heavy new supply typically softens prices + rents 12–24 months out; constrained supply supports both.
CashFlowRE · CFR-FQYS45DSM1W1VR
· Data 1 week ago
cashflowre.app · 2026-05-29