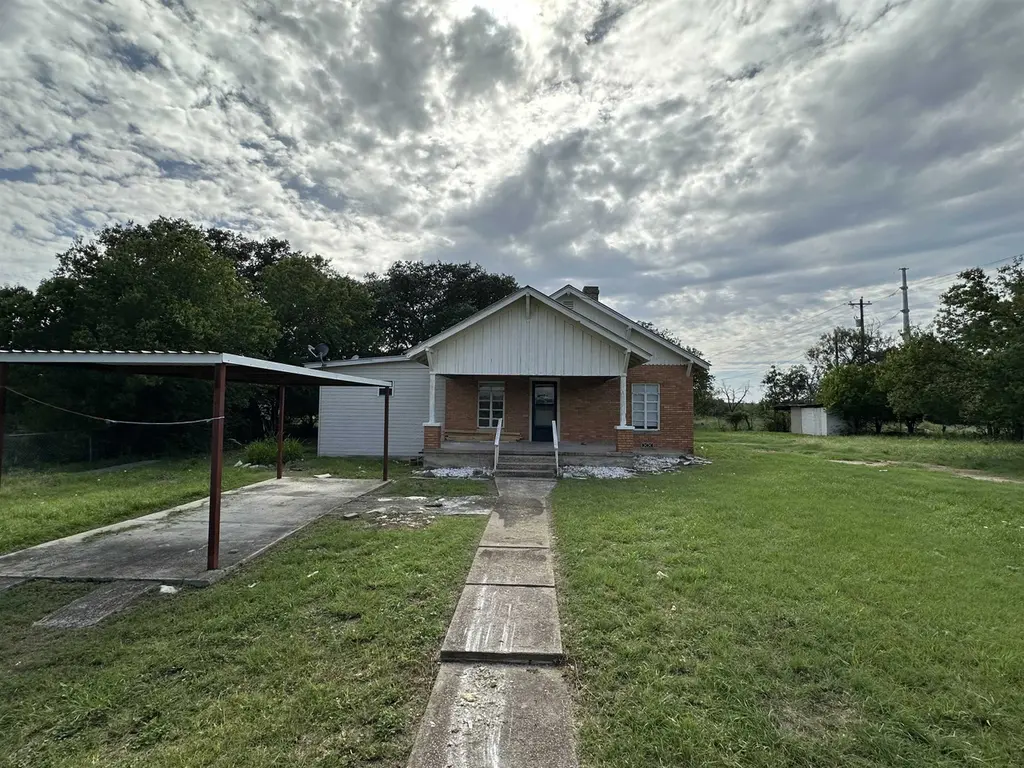
TBD FM 963
Bertram, TX 78611
$228,500D-
4 bd · 2.0 ba ·
1,878 sqft ·
Built 1930
· SingleFamily
· Active
· 312 DOM
Cashflow @ list (25.0% down · 7.5%)
Estimated rent
$1,840/mo
Mortgage (P&I)
−$1,198
Tax + insurance
−$381
HOA
−$0
Vac / Maint / Mgmt
−$386
Net cashflow
$-126/mo
Annual
$-1,507/yr
Cap rate
5.63%
Cash-on-cash
-2.36%
DSCR
0.90
1% rule
0.81%
Cash to close
$63,980
Investor read
- This is a 4-bed/2.0-bath single-family listed at $228k.
- At list price, monthly cash flow is $-126 ($-2k/yr) — negative.
- To cash-flow at today's rent, offer at most $210k (8.0% below list).
- To meet the 1% rule (rent ≥ 1% of price), the offer needs to be $184k (19.5% below list).
- It's been on market 312 days — a 12% lower offer ($201k) is reasonable based on typical stale-listing flexibility.
- Recommended offer: $184k (19.5% below list) — sets the bar for 1% rule.
- Local home prices are declining (-3.0%/yr); year-one equity from $2k of loan paydown is wiped out by about $7k of value loss. Plan a longer hold.
- Location reads 74/100 on livability (#170 in TX, #4,466 nationally) — a middle-class / working-renter tenant base. Strengths: crime A+, cost of living A+, housing A+; Watch: amenities F, commute F, health & safety F.
- Burnet CISD (rural): math 36% / reading 38% proficiency, ranked #465 of 826 in TX (top 56%) — families likely to look elsewhere, expect single-tenant / working-renter base with shorter leases.
- Zoned schools: Burnet Middle (math 32% / reading 33%, grade F, #947 of 1,662 statewide, top 58%, 731 students, 62% FRL) — zoned schools average 62% FRL vs 46% district-wide (15 pts higher); higher-poverty schools than district average — tighter screening recommended.
- Watch-outs: built in 1930 — expect roof / HVAC / electrical / plumbing capex.
- Market conditions: 554 active listings in the ZIP; solid renter incomes; 891 units permitted in Burnet County in 2024 (76 in 5+ unit buildings).
- Burnet County population projected at +22% by 2050 — long-run rental-demand tailwind backs the buy-and-hold thesis.
- 11 sale attempts since 7y ago; this cycle's ask is 17% above the opening price — seller raised mid-cycle; expect resistance to lowballs.
- Cap rate 5.6% vs local median 2.5% in Bertram — top-decile yield for the area; either an underpriced asset or a hidden risk that comps aren't pricing in. Stress-test before assuming the spread holds.
Questions for listing agent
- What do current leases actually rent for vs. the listed asking? Can we see a recent rent roll and the last 12 months of T-12 income?
- It's been on market 312 days. Have you received any prior offers? Is the seller open to a 19% concession, seller financing, or rate buy-down credit?
- Built in 1930 — when were the roof, HVAC, electrical panel, plumbing, and water heater last replaced?
- Why hasn't it sold? Are there any deal-killer items the seller is aware of (foundation, flood, title, zoning, code violations)?
- Is there a deadline driving the sale (1031 exchange, divorce, estate, relocation)? That informs how much negotiation room exists.
- Schools are D-rated, which usually means shorter tenancies and higher turnover. Who's the typical renter profile here, and what's been the actual vacancy rate?
- The area grade is low — what's the realistic commute time and amenity access for the typical tenant pool here? Any planned neighborhood developments (good or bad) we should know about?
- What's the average days-on-market for RENTAL listings here right now (not sales)? A rising rental-DOM trend means longer vacancies and softer asking-rent achievability than the comps imply.
CashFlowRE · CFR-FR95FDB0KG65R0
· Data 1 day ago
cashflowre.app · 2026-05-29