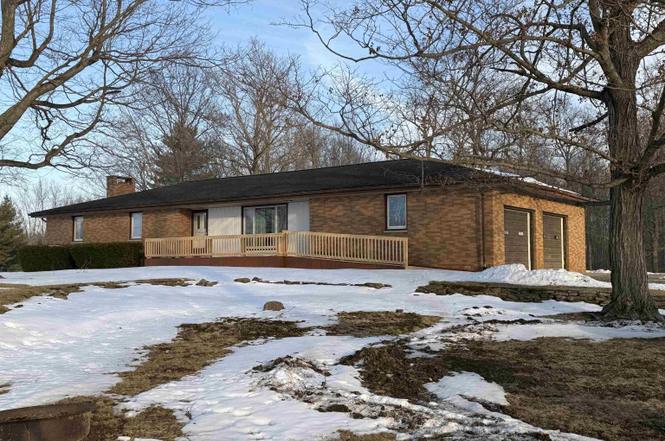
16326 Wappes Rd
Huntertown, IN 46723
$1D+
3 bd · 2.5 ba ·
1,628 sqft ·
Built 1968
· SingleFamily
· Pending
· 36 DOM
Cashflow @ list (25.0% down · 7.5%)
Estimated rent
$1,132/mo
Mortgage (P&I)
−$0
Tax + insurance
−$0
HOA
−$0
Vac / Maint / Mgmt
−$238
Net cashflow
$894/mo
Annual
$10,727/yr
Cap rate
1072716.88%
Cash-on-cash
3831109.24%
DSCR
170463.80
1% rule
113156.00%
Cash to close
$0
Investor read
- This is a 3-bed/2.5-bath single-family listed at $1.
- At list price, monthly cash flow is $894 ($11k/yr) — positive.
- The deal already cash-flows at list — no discount required.
- Meets the 1% rule at list price ($1k rent vs $1).
- It's been on market 36 days — a 3% lower offer ($0) is reasonable based on typical stale-listing flexibility.
- Local home prices are declining (-3.0%/yr); year-one equity from $0 of loan paydown is wiped out by about $0 of value loss. Plan a longer hold.
- Location reads 70/100 on livability (#159 in IN) — a middle-class / working-renter tenant base. Strengths: employment A+, cost of living A+, housing A+; Watch: amenities F, commute F, health & safety F.
- Northwest Allen County Schools (rural): math 51% / reading 58% proficiency, ranked #25 of 301 in IN (top 8%) — acceptable for families but not a draw, mixed tenant base, ~2y average lease; only 11% free/reduced lunch — higher-income household profile.
- Zoned schools: Huntertown Elementary School (math 44% / reading 36%, grade F, #494 of 994 statewide, top 50%, 506 students, 38% FRL); Carroll Middle School (math 39% / reading 55%, grade D+, #65 of 330 statewide, top 21%, 994 students, 29% FRL); Carroll High School (math 59% / reading 86%, grade B+, #10 of 369 statewide, top 3%, 2,554 students, 21% FRL) — zoned schools average 29% FRL vs 11% district-wide (18 pts higher); higher-poverty schools than district average — tighter screening recommended.
- Market conditions: 57 active listings in the ZIP; 1,861 units permitted in Allen County in 2024 (576 in 5+ unit buildings).
- Allen County population projected at +10% by 2050 — modest demand growth; plan on rents tracking national, not racing it.
- At projected returns (-3.0% appreciation + 3.0% rent growth), your $0 cash investment doubles in ~1 year — after that, you're playing with house money.
- Cap rate 1072716.9% vs local median 4.1% in Huntertown — top-decile yield for the area; either an underpriced asset or a hidden risk that comps aren't pricing in. Stress-test before assuming the spread holds.
Questions for listing agent
- It's been on market 36 days. Have you received any prior offers? Is the seller open to a 5% concession, seller financing, or rate buy-down credit?
- Built in 1968 — when were the roof, HVAC, electrical panel, plumbing, and water heater last replaced?
- Is there a deadline driving the sale (1031 exchange, divorce, estate, relocation)? That informs how much negotiation room exists.
- The area grade is low — what's the realistic commute time and amenity access for the typical tenant pool here? Any planned neighborhood developments (good or bad) we should know about?
- What's the average days-on-market for RENTAL listings here right now (not sales)? A rising rental-DOM trend means longer vacancies and softer asking-rent achievability than the comps imply.
- What's the recent tenant-quality profile in this submarket — average credit score on applications, eviction rate, late-payment / NSF rate, and stable-employment percentage? A property-management company in the area should have these aggregated.
- How much new for-sale + rental construction is in the pipeline within 1–3 miles? Heavy new supply typically softens prices + rents 12–24 months out; constrained supply supports both.
CashFlowRE · CFR-FVB0X3D095MJ5X
· Data 3 weeks ago
cashflowre.app · 2026-05-29