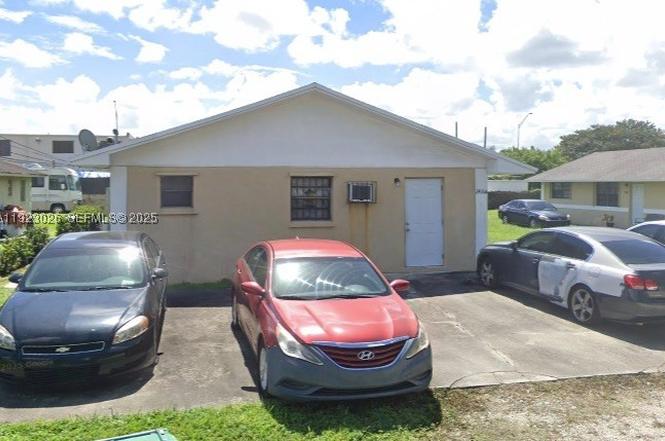
2416 NW 79th Ter
West Little River, FL 33147
$739,000D+
5 bd · 3.0 ba ·
2,088 sqft ·
Built 1988
· MultiFamily
· Active
· 199 DOM
Cashflow @ list (25.0% down · 7.5%)
Estimated rent
$7,358/mo
Mortgage (P&I)
−$3,875
Tax + insurance
−$1,025
HOA
−$0
Vac / Maint / Mgmt
−$1,545
Net cashflow
$913/mo
Annual
$10,951/yr
Cap rate
7.77%
Cash-on-cash
5.29%
DSCR
1.24
1% rule
1.00%
Cash to close
$206,920
Investor read
- This is a 3 × 3-bed/1.5-bath units multifamily listed at $739k.
- At list price, monthly cash flow is $913 ($11k/yr) — positive. Per door: $304/mo.
- The deal already cash-flows at list — no discount required.
- To meet the 1% rule (rent ≥ 1% of price), the offer needs to be $736k (0.4% below list).
- It's been on market 199 days — a 12% lower offer ($650k) is reasonable based on typical stale-listing flexibility.
- Recommended offer: $650k (12.0% below list) — sets the bar for market timing.
- Local home prices are declining (-3.0%/yr); year-one equity from $5k of loan paydown is wiped out by about $22k of value loss. Plan a longer hold.
- Location reads 79/100 on livability (#152 in FL, #2,286 nationally) — a middle-class / working-renter tenant base. Strengths: commute A+, cost of living A+, housing A+; Watch: amenities F, employment D-.
- Miami-Dade (suburban): math 45% / reading 54% proficiency, ranked #40 of 73 in FL (top 55%) — families likely to look elsewhere, expect single-tenant / working-renter base with shorter leases; 64% free/reduced lunch — lower-income household profile, screen leases tightly.
- Market conditions: Rents soft (-0.7%/yr); 228 active listings in the ZIP; 10,051 units permitted in Miami-Dade County in 2024 (7,758 in 5+ unit buildings).
- Miami-Dade County population projected at +28% by 2050 — long-run rental-demand tailwind backs the buy-and-hold thesis.
- 7 sale attempts since 13y ago with the ask held roughly flat each time — persistent listings suggest the price (not the market) is what's stuck; bring a comps-based counter.
- Current owner paid $218k; list at $739k implies a 240% gain — meaningful room to come down on a strong offer.
- Climate carrying-cost: severe wind risk, 99% chance of damaging wind over 30y; extreme-heat days projected 5→19/yr by 2055 (HVAC capex compounding) — expect insurance premiums to compound above CPI over the hold.
- Cap rate 7.8% vs local median 3.8% in West Little River — top-decile yield for the area; either an underpriced asset or a hidden risk that comps aren't pricing in. Stress-test before assuming the spread holds.
- At $7,358/mo this rent would consume 174% of the median local household income ($51k/yr) (locally 2419% of renters already pay >50% of income on rent) — very limited rent-growth headroom before tenants either downsize or default.
Questions for listing agent
- It's been on market 199 days. Have you received any prior offers? Is the seller open to a 12% concession, seller financing, or rate buy-down credit?
- Can we see the unit-by-unit rent roll, current vacancy, and any below-market leases? What's the average tenancy length?
- What capital expenditures (roof, boiler, parking lot, exteriors) have been made in the last 5 years, and what's planned in the next 2?
- Why hasn't it sold? Are there any deal-killer items the seller is aware of (foundation, flood, title, zoning, code violations)?
- Is there a deadline driving the sale (1031 exchange, divorce, estate, relocation)? That informs how much negotiation room exists.
- Schools are B-rated — typically a magnet for longer-tenancy family renters. What's the average tenant stay here, and is there a school-zone premium baked into asking?
- The area grade is low — what's the realistic commute time and amenity access for the typical tenant pool here? Any planned neighborhood developments (good or bad) we should know about?
- What's the average days-on-market for RENTAL listings here right now (not sales)? A rising rental-DOM trend means longer vacancies and softer asking-rent achievability than the comps imply.
CashFlowRE · CFR-FZT3902RXQMM3Y
· Data 2 days ago
cashflowre.app · 2026-05-29