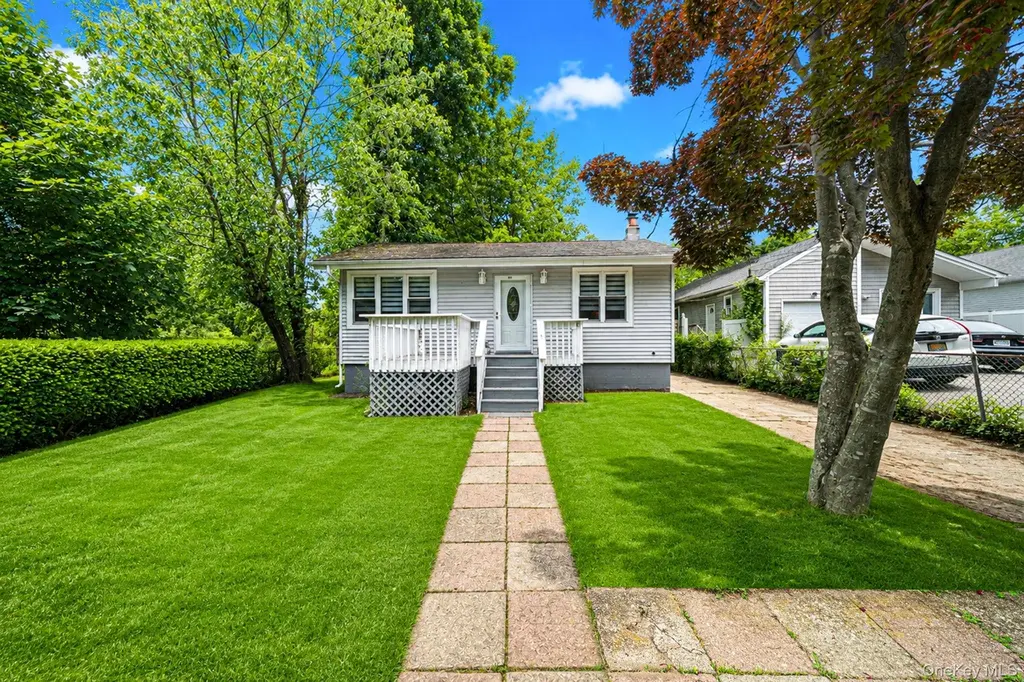
411 Glen Dr
Shirley, NY 11967
$350,000C+
2 bd · 2.5 ba ·
572 sqft ·
Built 1952
· SingleFamily
· Active
· 7 DOM
Cashflow @ list (25.0% down · 7.5%)
Estimated rent
$4,310/mo
Mortgage (P&I)
−$1,835
Tax + insurance
−$602
HOA
−$0
Vac / Maint / Mgmt
−$905
Net cashflow
$968/mo
Annual
$11,611/yr
Cap rate
9.61%
Cash-on-cash
11.85%
DSCR
1.53
1% rule
1.23%
Cash to close
$98,000
Investor read
- This is a 2-bed/2.5-bath single-family listed at $350k.
- At list price, monthly cash flow is $968 ($12k/yr) — positive.
- The deal already cash-flows at list — no discount required.
- Meets the 1% rule at list price ($4k rent vs $350k).
- Only 7 days on market — expect competitive offers; lowballing is unlikely to land.
- Local home prices are declining (-3.0%/yr); year-one equity from $2k of loan paydown is wiped out by about $10k of value loss. Plan a longer hold.
- Location reads 62/100 on livability (#886 in NY) — a middle-class / working-renter tenant base. Strengths: employment A+, housing A+; Watch: crime D+, amenities F, commute F.
- Longwood Central School District (rural): math 61% / reading 55% proficiency, ranked #235 of 590 in NY (top 40%) — acceptable for families but not a draw, mixed tenant base, ~2y average lease.
- Zoned schools: West Middle Island School (math 32% / reading 52%, grade F, #1,361 of 2,108 statewide, top 67%, 642 students, 46% FRL); Longwood Junior High School (math 67% / reading 67%, grade A-, #101 of 729 statewide, top 15%, 1,388 students, 48% FRL); Longwood High School (math 90% / reading 77%, grade A, #409 of 1,100 statewide, top 39%, 2,977 students, 44% FRL).
- Watch-outs: built in 1952 — expect roof / HVAC / electrical / plumbing capex.
- Market conditions: 183 active listings in the ZIP; 2 comparable units currently listed for rent nearby; 1,366 units permitted in Suffolk County in 2024 (216 in 5+ unit buildings).
- Suffolk County population projected to shrink 5% by 2050 — rents likely to lag national; underwrite the cash flow, not the appreciation.
- 2 sale attempts with the ask held roughly flat each time — persistent listings suggest the price (not the market) is what's stuck; bring a comps-based counter.
- At projected returns (-3.0% appreciation + 3.0% rent growth), your $98k cash investment doubles in ~10 years — after that, you're playing with house money.
- Climate carrying-cost: major flood risk; severe wind risk, 80% chance of damaging wind over 30y — expect insurance premiums to compound above CPI over the hold.
- Cap rate 9.6% vs local median 4.8% in Shirley — top-decile yield for the area; either an underpriced asset or a hidden risk that comps aren't pricing in. Stress-test before assuming the spread holds.
Questions for listing agent
- Built in 1952 — when were the roof, HVAC, electrical panel, plumbing, and water heater last replaced?
- Is there a deadline driving the sale (1031 exchange, divorce, estate, relocation)? That informs how much negotiation room exists.
- Schools are F-rated, which usually means shorter tenancies and higher turnover. Who's the typical renter profile here, and what's been the actual vacancy rate?
- Crime grade is D in this area — have there been break-ins, vandalism, or insurance claims at this property in the last 3 years? What carrier currently insures it and at what premium?
- What's the average days-on-market for RENTAL listings here right now (not sales)? A rising rental-DOM trend means longer vacancies and softer asking-rent achievability than the comps imply.
- What's the recent tenant-quality profile in this submarket — average credit score on applications, eviction rate, late-payment / NSF rate, and stable-employment percentage? A property-management company in the area should have these aggregated.
- How much new for-sale + rental construction is in the pipeline within 1–3 miles? Heavy new supply typically softens prices + rents 12–24 months out; constrained supply supports both.
CashFlowRE · CFR-G0ASRH2C9X7QNK
· Data 1 week ago
cashflowre.app · 2026-05-29