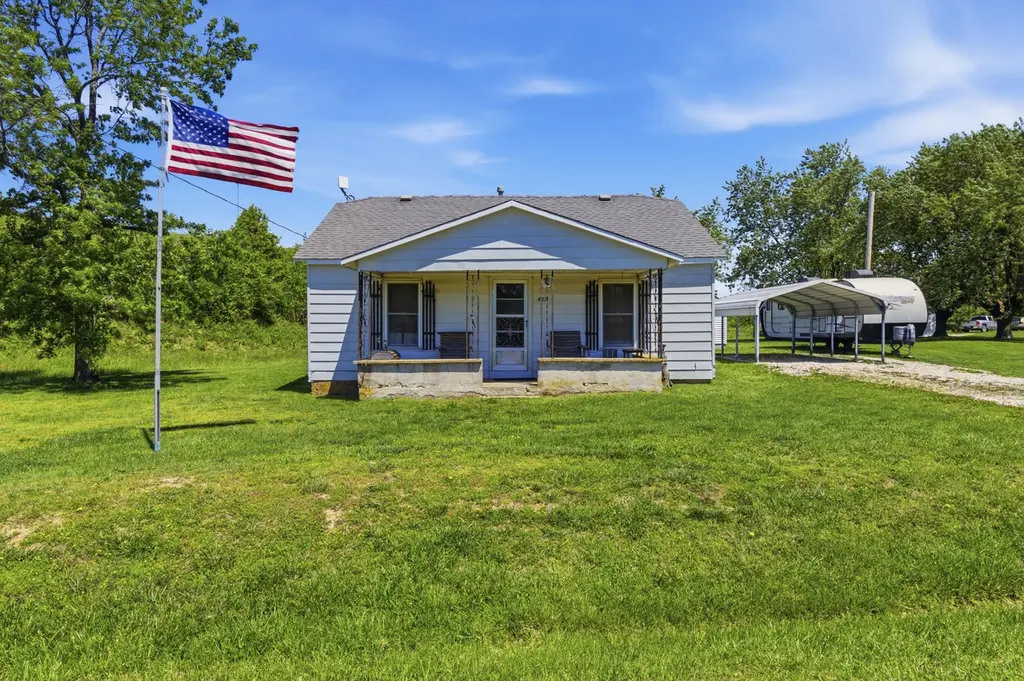
867 E Main St
Fordland, MO 65652
$135,000D+
3 bd · 1.0 ba ·
1,247 sqft ·
Built 1946
· Other
· Pending
· 8 DOM
Cashflow @ list (25.0% down · 7.5%)
Estimated rent
$1,099/mo
Mortgage (P&I)
−$708
Tax + insurance
−$86
HOA
−$0
Vac / Maint / Mgmt
−$231
Net cashflow
$74/mo
Annual
$892/yr
Cap rate
6.95%
Cash-on-cash
2.36%
DSCR
1.11
1% rule
0.81%
Cash to close
$37,800
Investor read
- This is a 3-bed/1.0-bath other listed at $135k.
- At list price, monthly cash flow is $74 ($892/yr) — positive.
- The deal already cash-flows at list — no discount required.
- To meet the 1% rule (rent ≥ 1% of price), the offer needs to be $110k (18.6% below list).
- Only 8 days on market — expect competitive offers; lowballing is unlikely to land.
- Recommended offer: $110k (18.6% below list) — sets the bar for 1% rule.
- Local home prices are declining (-3.0%/yr); year-one equity from $933 of loan paydown is wiped out by about $4k of value loss. Plan a longer hold.
- Location reads 58/100 on livability (#622 in MO) — a working-class tenant base; expect higher turnover. Strengths: cost of living A+, housing A+; Watch: crime F, amenities F, commute F.
- Fordland R-III (rural): math 35% / reading 39% proficiency, ranked #191 of 324 in MO (top 59%) — families likely to look elsewhere, expect single-tenant / working-renter base with shorter leases.
- Zoned schools: Fordland Elem. (math 32% / reading 32%, grade F, #761 of 1,115 statewide, top 72%, 285 students, 49% FRL); Fordland Middle (math 37% / reading 37%, grade F, #220 of 391 statewide, top 59%, 139 students, 36% FRL); Fordland High (math 24% / reading 74%, grade D, #124 of 521 statewide, top 28%, 186 students, 31% FRL) — zoned schools at 39% FRL track the district average.
- Watch-outs: built in 1946 — expect roof / HVAC / electrical / plumbing capex.
- Market conditions: 51 active listings in the ZIP; 168 units permitted in Webster County in 2024 (24 in 5+ unit buildings).
- Webster County population projected at +5% by 2050 — modest demand growth; plan on rents tracking national, not racing it.
- 2 sale attempts with the ask held roughly flat each time — persistent listings suggest the price (not the market) is what's stuck; bring a comps-based counter.
- Climate carrying-cost: moderate flood risk; moderate wildfire risk — expect insurance premiums to compound above CPI over the hold.
Questions for listing agent
- Built in 1946 — when were the roof, HVAC, electrical panel, plumbing, and water heater last replaced?
- Is there a deadline driving the sale (1031 exchange, divorce, estate, relocation)? That informs how much negotiation room exists.
- Crime grade is F in this area — have there been break-ins, vandalism, or insurance claims at this property in the last 3 years? What carrier currently insures it and at what premium?
- The area grade is low — what's the realistic commute time and amenity access for the typical tenant pool here? Any planned neighborhood developments (good or bad) we should know about?
- What's the average days-on-market for RENTAL listings here right now (not sales)? A rising rental-DOM trend means longer vacancies and softer asking-rent achievability than the comps imply.
- What's the recent tenant-quality profile in this submarket — average credit score on applications, eviction rate, late-payment / NSF rate, and stable-employment percentage? A property-management company in the area should have these aggregated.
- How much new for-sale + rental construction is in the pipeline within 1–3 miles? Heavy new supply typically softens prices + rents 12–24 months out; constrained supply supports both.
CashFlowRE · CFR-G1EC6TCSW7JKWH
· Data 1 week ago
cashflowre.app · 2026-05-29