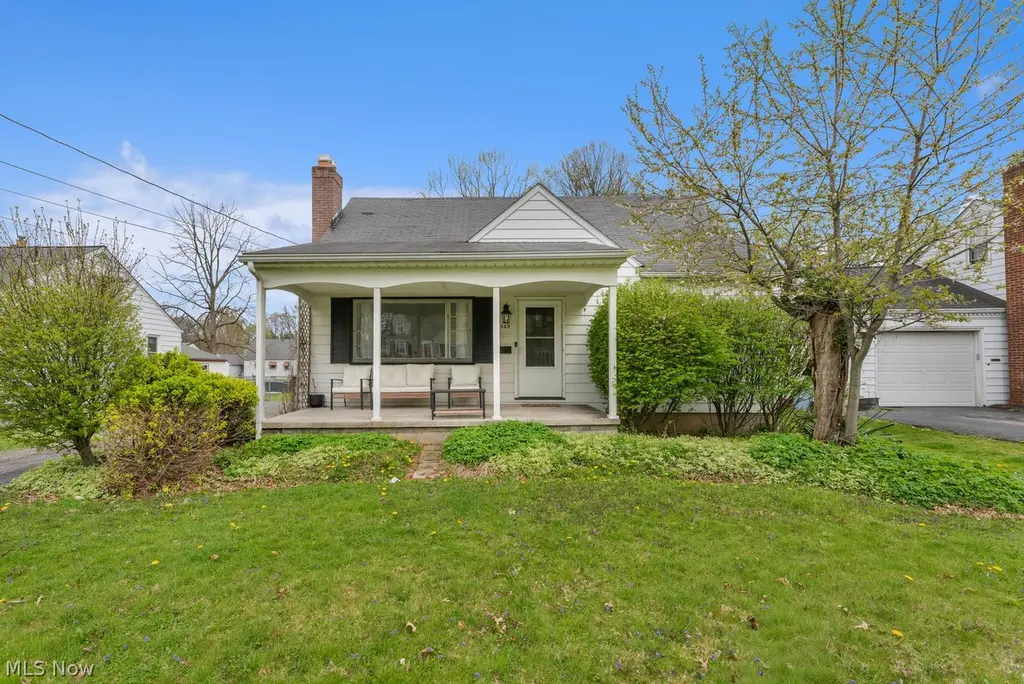
4649 Waseka Ln
Youngstown, OH 44512
$149,900D-
3 bd · 1.0 ba ·
1,152 sqft ·
Built 1952
· SingleFamily
· Pending
· 32 DOM
Cashflow @ list (25.0% down · 7.5%)
Estimated rent
$1,060/mo
Mortgage (P&I)
−$786
Tax + insurance
−$200
HOA
−$0
Vac / Maint / Mgmt
−$223
Net cashflow
$-149/mo
Annual
$-1,784/yr
Cap rate
5.10%
Cash-on-cash
-4.25%
DSCR
0.81
1% rule
0.71%
Cash to close
$41,972
Investor read
- This is a 3-bed/1.0-bath single-family listed at $150k.
- At list price, monthly cash flow is $-149 ($-2k/yr) — negative.
- To cash-flow at today's rent, offer at most $124k (17.5% below list).
- To meet the 1% rule (rent ≥ 1% of price), the offer needs to be $106k (29.3% below list).
- It's been on market 32 days — a 3% lower offer ($145k) is reasonable based on typical stale-listing flexibility.
- Recommended offer: $106k (29.3% below list) — sets the bar for 1% rule.
- Local home prices are declining (-3.0%/yr); year-one equity from $1k of loan paydown is wiped out by about $4k of value loss. Plan a longer hold.
- Location reads 81/100 on livability (#99 in OH, #1,506 nationally) — a professional / high-income tenant draw. Strengths: amenities A+, commute A+, cost of living A+; Watch: crime F, employment F.
- Boardman Local (urban): math 63% / reading 71% proficiency, ranked #189 of 656 in OH (top 29%) — acceptable for families but not a draw, mixed tenant base, ~2y average lease.
- Zoned schools: Robinwood Lane Elementary School (math 72% / reading 52%, grade B, #590 of 1,584 statewide, top 41%, 364 students, 65% FRL); Boardman Glenwood Junior High (math 65% / reading 65%, grade A-, #194 of 654 statewide, top 31%, 592 students, 52% FRL); Boardman High School (math 50% / reading 81%, grade B, #159 of 781 statewide, top 21%, 1,166 students, 48% FRL) — zoned schools average 55% FRL vs 34% district-wide (22 pts higher); higher-poverty schools than district average — tighter screening recommended.
- Watch-outs: built in 1952 — expect roof / HVAC / electrical / plumbing capex.
- Market conditions: Rents rising fast (+6.6%/yr); 138 active listings in the ZIP; 11 comparable units currently listed for rent nearby; rentals at typical pace (median 24d on market — plan ~3-4 weeks tenant-placement turnaround); 147 units permitted in Mahoning County in 2024 (0 in 5+ unit buildings).
- Mahoning County population projected at -14% by 2050 — secular population decline; favor cash flow + early exit over multi-decade hold.
- 5 sale attempts since 26y ago with the ask held roughly flat each time — persistent listings suggest the price (not the market) is what's stuck; bring a comps-based counter.
Questions for listing agent
- What do current leases actually rent for vs. the listed asking? Can we see a recent rent roll and the last 12 months of T-12 income?
- It's been on market 32 days. Have you received any prior offers? Is the seller open to a 29% concession, seller financing, or rate buy-down credit?
- Built in 1952 — when were the roof, HVAC, electrical panel, plumbing, and water heater last replaced?
- Is there a deadline driving the sale (1031 exchange, divorce, estate, relocation)? That informs how much negotiation room exists.
- Crime grade is F in this area — have there been break-ins, vandalism, or insurance claims at this property in the last 3 years? What carrier currently insures it and at what premium?
- The area grade is low — what's the realistic commute time and amenity access for the typical tenant pool here? Any planned neighborhood developments (good or bad) we should know about?
- What's the average days-on-market for RENTAL listings here right now (not sales)? A rising rental-DOM trend means longer vacancies and softer asking-rent achievability than the comps imply.
- What's the recent tenant-quality profile in this submarket — average credit score on applications, eviction rate, late-payment / NSF rate, and stable-employment percentage? A property-management company in the area should have these aggregated.
CashFlowRE · CFR-G1NK5N1MGQFT0M
· Data 2 weeks ago
cashflowre.app · 2026-05-29