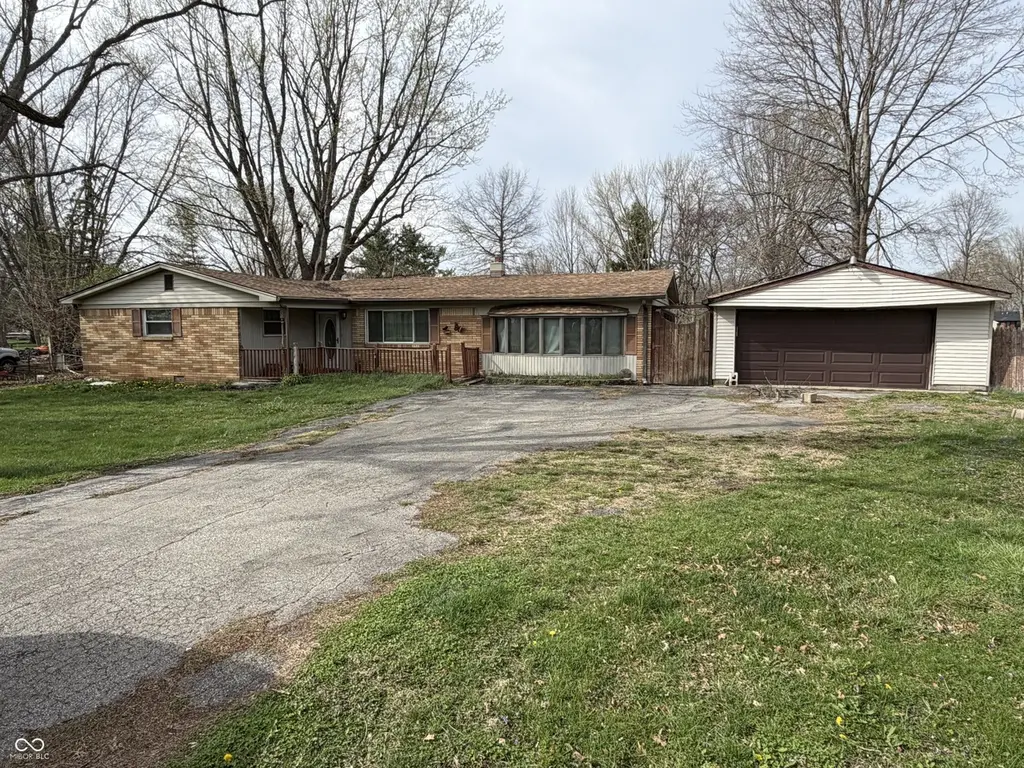
3190 Chapel Rd
Anderson, IN 46012
$2F
3 bd · 1.5 ba ·
1,715 sqft ·
Built 1962
· SingleFamily
· Pending
· 19 DOM
Cashflow @ list (25.0% down · 7.5%)
Estimated rent
$1,493/mo
Mortgage (P&I)
−$1,284
Tax + insurance
−$408
HOA
−$0
Vac / Maint / Mgmt
−$313
Net cashflow
$-513/mo
Annual
$-6,151/yr
Cap rate
3.78%
Cash-on-cash
-8.97%
DSCR
0.60
1% rule
0.61%
Cash to close
$68,544
Investor read
- This is a 3-bed/1.5-bath single-family listed at $2.
- At list price, monthly cash flow is $-513 ($-6k/yr) — negative.
- The deal already cash-flows at list — no discount required.
- Meets the 1% rule at list price ($1k rent vs $2).
- It's been on market 19 days — a 2% lower offer ($1) is reasonable based on typical stale-listing flexibility.
- Recommended offer: $1 (50.0% below list) — sets the bar for market timing.
- Local home prices are declining (-3.0%/yr); year-one equity from $2k of loan paydown is wiped out by about $7k of value loss. Plan a longer hold.
- Location reads 60/100 on livability (#521 in IN) — a middle-class / working-renter tenant base. Strengths: cost of living A+, housing A+; Watch: schools F, crime D-, amenities F.
- Anderson Community School Corporation (urban): math 15% / reading 23% proficiency, ranked #280 of 301 in IN (top 93%) — low school quality limits family demand, transient renter base, plan for 1-2y turnover; 70% free/reduced lunch — lower-income household profile, screen leases tightly.
- Watch-outs: property tax is 183599.4% of price.
- Market conditions: Rents rising (+1.8%/yr); 162 active listings in the ZIP; 184 units permitted in Madison County in 2024 (0 in 5+ unit buildings).
- Madison County population projected at -14% by 2050 — secular population decline; favor cash flow + early exit over multi-decade hold.
- Cap rate 3.8% vs local median 6.5% in Anderson — below-typical yield; the buyer is paying a premium for something (appreciation thesis, condition, location) that the cap rate doesn't capture.
- This rent runs 31% of the median local income ($58k/yr) — at the standard rent-burdened threshold; future hikes will face affordability resistance.
Questions for listing agent
- What do current leases actually rent for vs. the listed asking? Can we see a recent rent roll and the last 12 months of T-12 income?
- Built in 1962 — when were the roof, HVAC, electrical panel, plumbing, and water heater last replaced?
- Property tax is high relative to price — has the assessment been appealed recently, and will the sale trigger a re-assessment?
- Is there a deadline driving the sale (1031 exchange, divorce, estate, relocation)? That informs how much negotiation room exists.
- Schools are F-rated, which usually means shorter tenancies and higher turnover. Who's the typical renter profile here, and what's been the actual vacancy rate?
- Crime grade is D in this area — have there been break-ins, vandalism, or insurance claims at this property in the last 3 years? What carrier currently insures it and at what premium?
- The area grade is low — what's the realistic commute time and amenity access for the typical tenant pool here? Any planned neighborhood developments (good or bad) we should know about?
- What's the average days-on-market for RENTAL listings here right now (not sales)? A rising rental-DOM trend means longer vacancies and softer asking-rent achievability than the comps imply.
CashFlowRE · CFR-G1YZR074NG3BP4
· Data 3 weeks ago
cashflowre.app · 2026-05-29