13 Sutton Pl
Shaker Heights, OH 44120
$149,900D
3 bd · 2.5 ba ·
1,624 sqft ·
Built 1971
· Condo
· Active
· 3 DOM
Cashflow @ list (25.0% down · 7.5%)
Estimated rent
$1,650/mo
Mortgage (P&I)
−$786
Tax + insurance
−$250
HOA
−$326
Vac / Maint / Mgmt
−$347
Net cashflow
$-58/mo
Annual
$-701/yr
Cap rate
5.83%
Cash-on-cash
-1.67%
DSCR
0.93
1% rule
1.10%
Cash to close
$41,972
Investor read
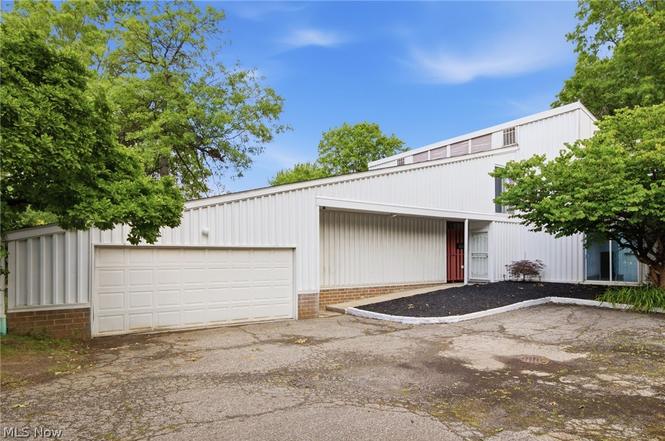
- This is a 3-bed/2.5-bath condo listed at $150k. Condition is rated good.
- At list price, monthly cash flow is $-58 ($-701/yr) — negative.
- To cash-flow at today's rent, offer at most $141k (5.6% below list).
- Meets the 1% rule at list price ($2k rent vs $150k).
- Only 3 days on market — expect competitive offers; lowballing is unlikely to land.
- Recommended offer: $141k (5.6% below list) — sets the bar for cash-flow.
- Local home prices are declining (-3.0%/yr); year-one equity from $1k of loan paydown is wiped out by about $4k of value loss. Plan a longer hold.
- Location reads 89/100 on livability (#15 in OH, #134 nationally) — a professional / high-income tenant draw. Strengths: crime A+, commute A+, employment A+; Watch: amenities F.
- Shaker Heights City (suburban): math 50% / reading 63% proficiency, ranked #309 of 656 in OH (top 47%) — acceptable for families but not a draw, mixed tenant base, ~2y average lease.
- Zoned schools: Onaway Elementary School (math 67% / reading 67%, grade B+, #456 of 1,584 statewide, top 31%, 386 students, 21% FRL); Shaker Hts Middle School (math 49% / reading 56%, grade C+, #378 of 654 statewide, top 59%, 651 students, 30% FRL); Shaker Hts High School (math 34% / reading 70%, grade D+, #343 of 781 statewide, top 47%, 1,498 students, 24% FRL).
- Market conditions: Rents rising (+3.3%/yr); 128 active listings in the ZIP; 40 comparable units currently listed for rent nearby; rentals at typical pace (median 26d on market — plan ~3-4 weeks tenant-placement turnaround); 1,441 units permitted in Cuyahoga County in 2024 (700 in 5+ unit buildings).
- Cuyahoga County population projected to shrink 8% by 2050 — rents likely to lag national; underwrite the cash flow, not the appreciation.
- Cap rate 5.8% vs local median 2.5% in Shaker Heights — top-decile yield for the area; either an underpriced asset or a hidden risk that comps aren't pricing in. Stress-test before assuming the spread holds.
- This rent runs 42% of the median local income ($47k/yr) — at the standard rent-burdened threshold; future hikes will face affordability resistance.
Questions for listing agent
- What do current leases actually rent for vs. the listed asking? Can we see a recent rent roll and the last 12 months of T-12 income?
- Built in 1971 — when were the roof, HVAC, electrical panel, plumbing, and water heater last replaced?
- What does the HOA fee cover, when was the last increase, and are there any pending special assessments or reserve-fund shortfalls?
- Any open or pending special assessments — roof, HVAC, plumbing, elevator, façade? What's the per-unit balance and payoff schedule, and is the seller paying it off at close or rolling it to the buyer?
- Is there a deadline driving the sale (1031 exchange, divorce, estate, relocation)? That informs how much negotiation room exists.
- Schools are A-rated — typically a magnet for longer-tenancy family renters. What's the average tenant stay here, and is there a school-zone premium baked into asking?
- The area grade is low — what's the realistic commute time and amenity access for the typical tenant pool here? Any planned neighborhood developments (good or bad) we should know about?
- What's the average days-on-market for RENTAL listings here right now (not sales)? A rising rental-DOM trend means longer vacancies and softer asking-rent achievability than the comps imply.
CashFlowRE · CFR-G5KMKGE910W2AD
· Data 23 h ago
cashflowre.app · 2026-05-29