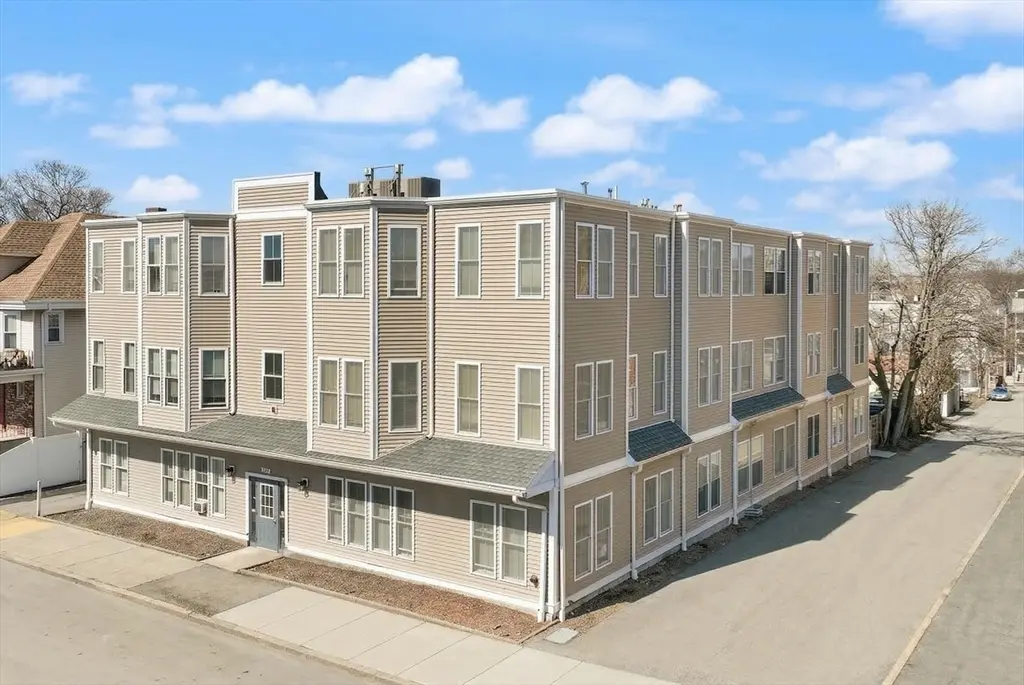
145 Lewis St
Lynn, MA 01902
$6,100,000C
33 bd · 26.0 ba ·
17,407 sqft ·
Built 2015
· MultiFamily
· Active
· 66 DOM
Cashflow @ list (25.0% down · 7.5%)
Estimated rent
$83,360/mo
Mortgage (P&I)
−$31,989
Tax + insurance
−$7,334
HOA
−$0
Vac / Maint / Mgmt
−$17,506
Net cashflow
$26,531/mo
Annual
$318,377/yr
Cap rate
11.51%
Cash-on-cash
18.64%
DSCR
1.83
1% rule
1.37%
Cash to close
$1,708,000
Investor read
- This is a 25 × 33-bed/26.0-bath units multifamily listed at $6.10M.
- At list price, monthly cash flow is $27k ($318k/yr) — positive. Per door: $1k/mo.
- The deal already cash-flows at list — no discount required.
- Meets the 1% rule at list price ($83k rent vs $6.10M).
- It's been on market 66 days — a 6% lower offer ($5.73M) is reasonable based on typical stale-listing flexibility.
- Recommended offer: $5.73M (6.0% below list) — sets the bar for market timing.
- Local home prices are declining (-3.0%/yr); year-one equity from $42k of loan paydown is wiped out by about $183k of value loss. Plan a longer hold.
- Location reads 75/100 on livability (#74 in MA, #4,077 nationally) — a middle-class / working-renter tenant base. Strengths: commute A+, health & safety A+, housing B+; Watch: amenities C-, schools D+, crime D-.
- Lynn (suburban): math 14% / reading 25% proficiency, ranked #293 of 302 in MA (top 97%) — low school quality limits family demand, transient renter base, plan for 1-2y turnover; 73% free/reduced lunch — lower-income household profile, screen leases tightly.
- Market conditions: Rents flat; 51 active listings in the ZIP; 1,032 units permitted in Essex County in 2024 (590 in 5+ unit buildings).
- Essex County population projected at +15% by 2050 — long-run rental-demand tailwind backs the buy-and-hold thesis.
- Current owner paid $975k; list at $6.10M implies a 526% gain — meaningful room to come down on a strong offer.
- At projected returns (-3.0% appreciation + 0.7% rent growth), your $1.71M cash investment doubles in ~8 years — after that, you're playing with house money.
- Climate carrying-cost: major wind risk, 72% chance of damaging wind over 30y; extreme-heat days projected 7→15/yr by 2055 (HVAC capex compounding) — expect insurance premiums to compound above CPI over the hold.
- Cap rate 11.5% vs local median 3.6% in Lynn — top-decile yield for the area; either an underpriced asset or a hidden risk that comps aren't pricing in. Stress-test before assuming the spread holds.
- At $83,360/mo this rent would consume 1492% of the median local household income ($67k/yr) (locally 3883% of renters already pay >50% of income on rent) — very limited rent-growth headroom before tenants either downsize or default.
Questions for listing agent
- It's been on market 66 days. Have you received any prior offers? Is the seller open to a 6% concession, seller financing, or rate buy-down credit?
- Can we see the unit-by-unit rent roll, current vacancy, and any below-market leases? What's the average tenancy length?
- What capital expenditures (roof, boiler, parking lot, exteriors) have been made in the last 5 years, and what's planned in the next 2?
- Why hasn't it sold? Are there any deal-killer items the seller is aware of (foundation, flood, title, zoning, code violations)?
- Is there a deadline driving the sale (1031 exchange, divorce, estate, relocation)? That informs how much negotiation room exists.
- Schools are D-rated, which usually means shorter tenancies and higher turnover. Who's the typical renter profile here, and what's been the actual vacancy rate?
- Crime grade is D in this area — have there been break-ins, vandalism, or insurance claims at this property in the last 3 years? What carrier currently insures it and at what premium?
- What's the average days-on-market for RENTAL listings here right now (not sales)? A rising rental-DOM trend means longer vacancies and softer asking-rent achievability than the comps imply.
CashFlowRE · CFR-G64B6P8JZGPFJD
· Data 2 days ago
cashflowre.app · 2026-05-29