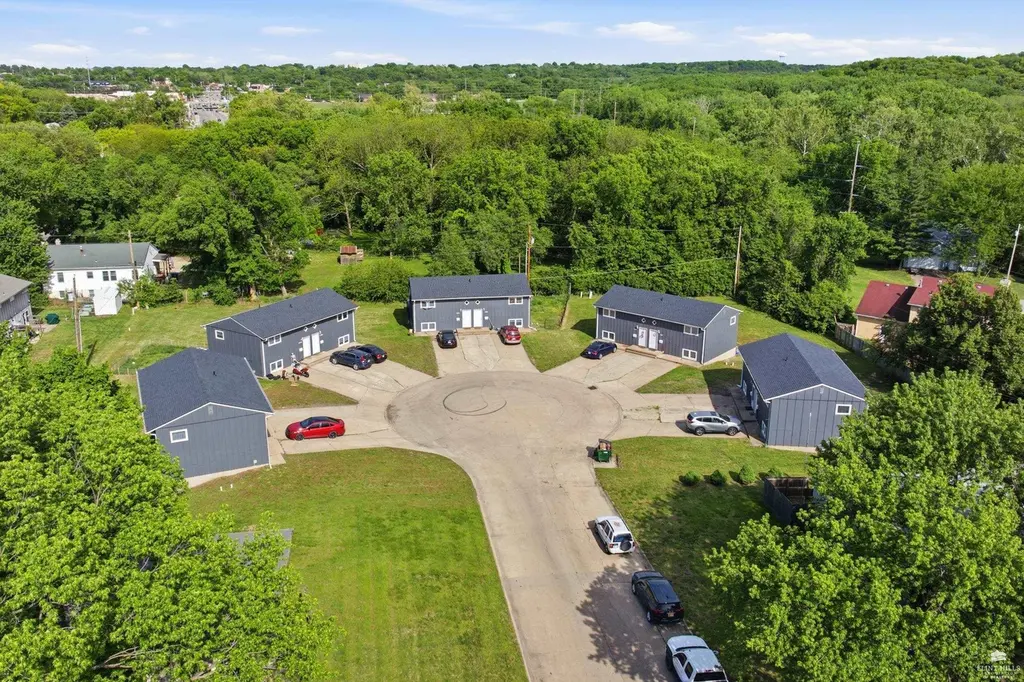
3305-3307 Fairman Cir
Manhattan, KS 66503
$350,000D
6 bd · 3.0 ba ·
1,056 sqft ·
Built 1970
· MultiFamily
· Active
· 37 DOM
Cashflow @ list (25.0% down · 7.5%)
Estimated rent
$2,953/mo
Mortgage (P&I)
−$1,835
Tax + insurance
−$446
HOA
−$0
Vac / Maint / Mgmt
−$620
Net cashflow
$52/mo
Annual
$621/yr
Cap rate
6.47%
Cash-on-cash
0.63%
DSCR
1.03
1% rule
0.84%
Cash to close
$98,000
Investor read
- This is a 2 × 3-bed/?-bath units multifamily listed at $350k.
- At list price, monthly cash flow is $52 ($621/yr) — positive. Per door: $26/mo.
- The deal already cash-flows at list — no discount required.
- To meet the 1% rule (rent ≥ 1% of price), the offer needs to be $295k (15.6% below list).
- It's been on market 37 days — a 3% lower offer ($340k) is reasonable based on typical stale-listing flexibility.
- Recommended offer: $295k (15.6% below list) — sets the bar for 1% rule.
- Local home prices are declining (-3.0%/yr); year-one equity from $2k of loan paydown is wiped out by about $10k of value loss. Plan a longer hold.
- Location reads 83/100 on livability (#6 in KS, #979 nationally) — a professional / high-income tenant draw. Strengths: amenities A+, commute A+, cost of living A+; Watch: crime C-, employment C-.
- Manhattan-Ogden (urban): math 39% / reading 46% proficiency, ranked #26 of 169 in KS (top 15%) — families likely to look elsewhere, expect single-tenant / working-renter base with shorter leases.
- Market conditions: Rents rising (+3.0%/yr); 189 active listings in the ZIP; solid renter incomes; 132 units permitted in Riley County in 2024 (35 in 5+ unit buildings).
- Riley County population projected at +30% by 2050 — long-run rental-demand tailwind backs the buy-and-hold thesis.
- Climate carrying-cost: moderate wildfire risk — expect insurance premiums to compound above CPI over the hold.
- This rent runs 36% of the median local income ($98k/yr) — at the standard rent-burdened threshold; future hikes will face affordability resistance.
Questions for listing agent
- It's been on market 37 days. Have you received any prior offers? Is the seller open to a 16% concession, seller financing, or rate buy-down credit?
- Can we see the unit-by-unit rent roll, current vacancy, and any below-market leases? What's the average tenancy length?
- What capital expenditures (roof, boiler, parking lot, exteriors) have been made in the last 5 years, and what's planned in the next 2?
- Built in 1970 — when were the roof, HVAC, electrical panel, plumbing, and water heater last replaced?
- Is there a deadline driving the sale (1031 exchange, divorce, estate, relocation)? That informs how much negotiation room exists.
- The area grade is low — what's the realistic commute time and amenity access for the typical tenant pool here? Any planned neighborhood developments (good or bad) we should know about?
- What's the average days-on-market for RENTAL listings here right now (not sales)? A rising rental-DOM trend means longer vacancies and softer asking-rent achievability than the comps imply.
- What's the recent tenant-quality profile in this submarket — average credit score on applications, eviction rate, late-payment / NSF rate, and stable-employment percentage? A property-management company in the area should have these aggregated.
CashFlowRE · CFR-G96FCFDQY8JZK4
· Data 1 day ago
cashflowre.app · 2026-05-29