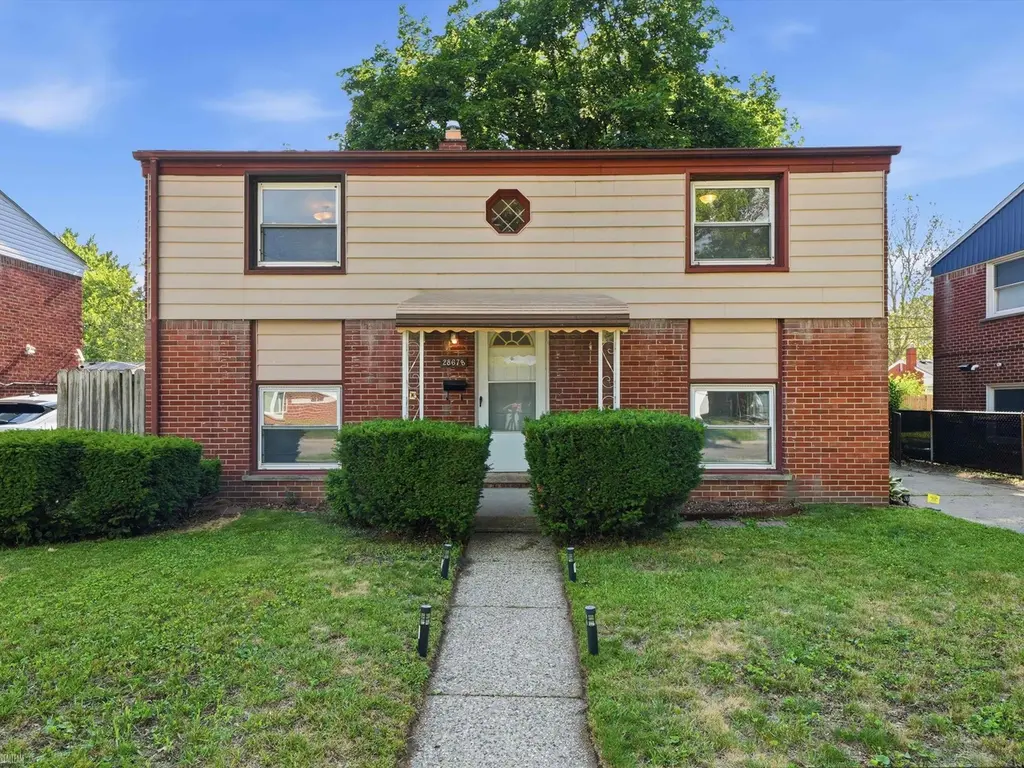
28678 Hales St
Madison Heights, MI 48071
$210,000C-
3 bd · 1.5 ba ·
1,382 sqft ·
Built 1957
· SingleFamily
· Active
· 2 DOM
Cashflow @ list (25.0% down · 7.5%)
Estimated rent
$2,309/mo
Mortgage (P&I)
−$1,101
Tax + insurance
−$586
HOA
−$0
Vac / Maint / Mgmt
−$485
Net cashflow
$136/mo
Annual
$1,638/yr
Cap rate
7.07%
Cash-on-cash
2.79%
DSCR
1.12
1% rule
1.10%
Cash to close
$58,800
Investor read
- This is a 3-bed/1.5-bath single-family listed at $210k.
- At list price, monthly cash flow is $136 ($2k/yr) — positive.
- The deal already cash-flows at list — no discount required.
- Meets the 1% rule at list price ($2k rent vs $210k).
- Only 2 days on market — expect competitive offers; lowballing is unlikely to land.
- Local home prices are declining (-3.0%/yr); year-one equity from $1k of loan paydown is wiped out by about $6k of value loss. Plan a longer hold.
- Location reads 81/100 on livability (#62 in MI, #1,347 nationally) — a professional / high-income tenant draw. Strengths: commute A+, cost of living A+, housing A+; Watch: health & safety D.
- Lamphere Public Schools (suburban): math 28% / reading 49% proficiency, ranked #235 of 540 in MI (top 44%) — families likely to look elsewhere, expect single-tenant / working-renter base with shorter leases.
- Zoned schools: Edmonson Elementary School (math 27% / reading 57%, grade F, #547 of 1,397 statewide, top 41%, 280 students, 56% FRL); Page Middle School (math 23% / reading 47%, grade F, #283 of 493 statewide, top 58%, 554 students, 54% FRL); Lamphere High School (math 32% / reading 57%, grade F, #214 of 713 statewide, top 36%, 729 students, 48% FRL).
- Watch-outs: property tax is 2.8% of price; built in 1957 — expect roof / HVAC / electrical / plumbing capex.
- Market conditions: Rents rising (+2.8%/yr); 141 active listings in the ZIP; 20 comparable units currently listed for rent nearby; rentals leasing fast (median 7d on market — plan ~1-2 weeks tenant-placement turnaround); 2,614 units permitted in Oakland County in 2024 (721 in 5+ unit buildings).
- Oakland County population projected at +10% by 2050 — modest demand growth; plan on rents tracking national, not racing it.
- Current owner paid $134k; list at $210k implies a 57% gain — meaningful room to come down on a strong offer.
- Cap rate 7.1% vs local median 5.7% in Madison Heights — meaningfully above typical; check what's discounted (condition, days-on-market, listing class) to confirm the premium yield is real.
- This rent runs 40% of the median local income ($70k/yr) — at the standard rent-burdened threshold; future hikes will face affordability resistance.
Questions for listing agent
- Built in 1957 — when were the roof, HVAC, electrical panel, plumbing, and water heater last replaced?
- Property tax is high relative to price — has the assessment been appealed recently, and will the sale trigger a re-assessment?
- Is there a deadline driving the sale (1031 exchange, divorce, estate, relocation)? That informs how much negotiation room exists.
- Schools are D-rated, which usually means shorter tenancies and higher turnover. Who's the typical renter profile here, and what's been the actual vacancy rate?
- What's the average days-on-market for RENTAL listings here right now (not sales)? A rising rental-DOM trend means longer vacancies and softer asking-rent achievability than the comps imply.
- What's the recent tenant-quality profile in this submarket — average credit score on applications, eviction rate, late-payment / NSF rate, and stable-employment percentage? A property-management company in the area should have these aggregated.
- How much new for-sale + rental construction is in the pipeline within 1–3 miles? Heavy new supply typically softens prices + rents 12–24 months out; constrained supply supports both.
CashFlowRE · CFR-GBJBSSE4G95S49
· Data 20 h ago
cashflowre.app · 2026-05-29