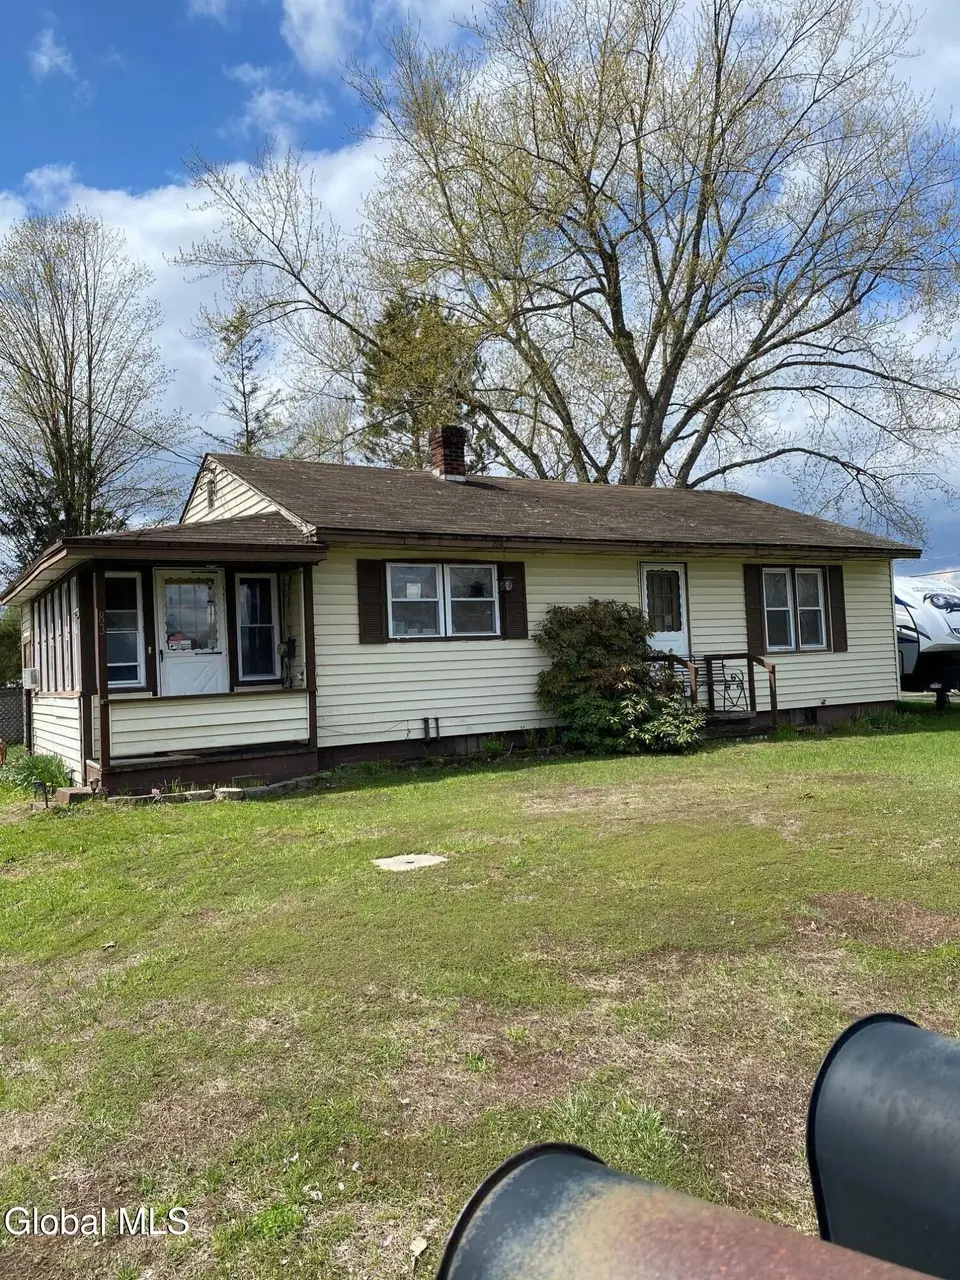
83 Northville Rd
Northville, NY 12134
$249,000C-
2 bd · 1.0 ba ·
864 sqft ·
Built 1960
· SingleFamily
· Active
· 47 DOM
Cashflow @ list (25.0% down · 7.5%)
Estimated rent
$1,725/mo
Mortgage (P&I)
−$1,306
Tax + insurance
−$206
HOA
−$0
Vac / Maint / Mgmt
−$362
Net cashflow
$-149/mo
Annual
$-1,790/yr
Cap rate
5.57%
Cash-on-cash
-2.57%
DSCR
0.89
1% rule
0.69%
Cash to close
$69,720
Investor read
- This is a 2-bed/1.0-bath single-family listed at $249k.
- At list price, monthly cash flow is $-149 ($-2k/yr) — negative.
- To cash-flow at today's rent, offer at most $223k (10.6% below list).
- To meet the 1% rule (rent ≥ 1% of price), the offer needs to be $172k (30.7% below list).
- It's been on market 47 days — a 3% lower offer ($242k) is reasonable based on typical stale-listing flexibility.
- Recommended offer: $172k (30.7% below list) — sets the bar for 1% rule.
- In year one you build about $27k of equity ($2k loan paydown + $25k appreciation (10.0% local appreciation)).
- Location reads 64/100 on livability (#759 in NY) — a middle-class / working-renter tenant base. Strengths: crime A+, employment A+, housing A; Watch: amenities F, commute F, cost of living F.
- Edinburg Common School District (rural): math 20% / reading 30% proficiency, ranked #739 of 755 in NY (top 98%) — low school quality limits family demand, transient renter base, plan for 1-2y turnover.
- Zoned schools: Edinburg Common School (math 50% / reading 50%, grade D, #1,085 of 2,108 statewide, top 56%, 52 students, 56% FRL).
- Zoned-school proficiency averages 50% at this address vs 25% district-wide (+24 pts) — the actual schools serving this property are materially stronger than the Edinburg Common School District average implies; a family-tenant draw the district grade alone would hide.
- Market conditions: 50 active listings in the ZIP; 1,132 units permitted in Saratoga County in 2024 (378 in 5+ unit buildings).
- Saratoga County population projected at +4% by 2050 — modest demand growth; plan on rents tracking national, not racing it.
- 3 sale attempts since 11y ago; this cycle's ask has dropped $40k (14%) from the opening price — seller is motivated, your offer sets the floor, not the list.
- Current owner paid $65k; list at $249k implies a 284% gain — meaningful room to come down on a strong offer.
- By year 2, paydown + projected appreciation supports a ~$43k cash-out refi (75% LTV) — recoverable capital for the next deal without selling this one.
- Cap rate 5.6% vs local median 2.9% in Northville — top-decile yield for the area; either an underpriced asset or a hidden risk that comps aren't pricing in. Stress-test before assuming the spread holds.
Questions for listing agent
- What do current leases actually rent for vs. the listed asking? Can we see a recent rent roll and the last 12 months of T-12 income?
- It's been on market 47 days. Have you received any prior offers? Is the seller open to a 31% concession, seller financing, or rate buy-down credit?
- Built in 1960 — when were the roof, HVAC, electrical panel, plumbing, and water heater last replaced?
- Is there a deadline driving the sale (1031 exchange, divorce, estate, relocation)? That informs how much negotiation room exists.
- Schools are B-rated — typically a magnet for longer-tenancy family renters. What's the average tenant stay here, and is there a school-zone premium baked into asking?
- What's the average days-on-market for RENTAL listings here right now (not sales)? A rising rental-DOM trend means longer vacancies and softer asking-rent achievability than the comps imply.
- What's the recent tenant-quality profile in this submarket — average credit score on applications, eviction rate, late-payment / NSF rate, and stable-employment percentage? A property-management company in the area should have these aggregated.
- How much new for-sale + rental construction is in the pipeline within 1–3 miles? Heavy new supply typically softens prices + rents 12–24 months out; constrained supply supports both.
CashFlowRE · CFR-GCE85N3T9BD7H5
· Data 14 h ago
cashflowre.app · 2026-05-29