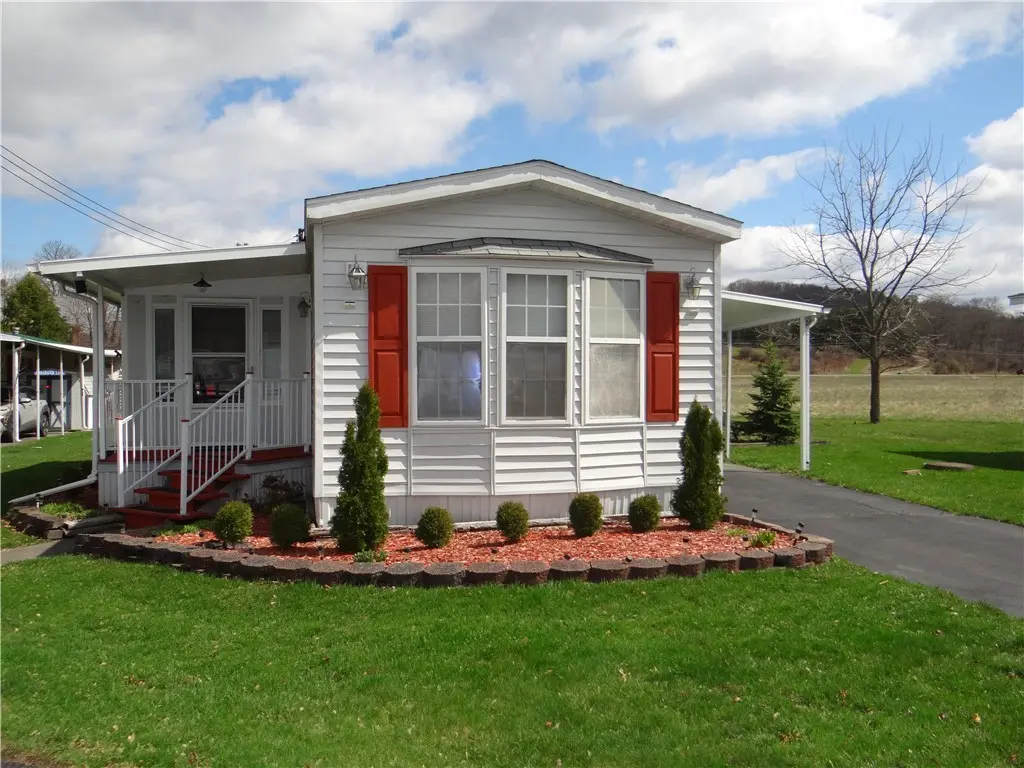
34 Breesport Rd # 46
Horseheads North, NY 14845
$34,900B+
2 bd · 1.0 ba ·
980 sqft ·
Built 1997
· Manufactured
· Pending
· 57 DOM
Cashflow @ list (25.0% down · 7.5%)
Estimated rent
$995/mo
Mortgage (P&I)
−$183
Tax + insurance
−$520
HOA
−$0
Vac / Maint / Mgmt
−$209
Net cashflow
$83/mo
Annual
$994/yr
Cap rate
24.97%
Cash-on-cash
66.71%
DSCR
3.97
1% rule
2.85%
Cash to close
$9,772
Investor read
- This is a 2-bed/1.0-bath manufactured listed at $35k.
- At list price, monthly cash flow is $83 ($994/yr) — positive.
- The deal already cash-flows at list — no discount required.
- Meets the 1% rule at list price ($995 rent vs $35k).
- It's been on market 57 days — a 3% lower offer ($34k) is reasonable based on typical stale-listing flexibility.
- Recommended offer: $34k (3.0% below list) — sets the bar for market timing.
- Local home prices are declining (-3.0%/yr); year-one equity from $241 of loan paydown is wiped out by about $1k of value loss. Plan a longer hold.
- Location reads 65/100 on livability (#670 in NY) — a middle-class / working-renter tenant base. Strengths: housing A+, crime A-, employment A-; Watch: health & safety D, amenities F, commute F.
- Horseheads Central School District (suburban): math 44% / reading 58% proficiency, ranked #347 of 590 in NY (top 59%) — acceptable for families but not a draw, mixed tenant base, ~2y average lease.
- Zoned schools: Ridge Road School (math 42% / reading 72%, grade C+, #842 of 2,108 statewide, top 43%, 400 students, 34% FRL); Horseheads Middle School (math 29% / reading 50%, grade F, #418 of 729 statewide, top 59%, 572 students, 36% FRL); Horseheads Senior High School (math 95% / reading 98%, grade A+, #59 of 1,100 statewide, top 6%, 1,142 students, 27% FRL).
- Zoned-school proficiency averages 64% at this address vs 51% district-wide (+13 pts) — the actual schools serving this property are materially stronger than the Horseheads Central School District average implies; a family-tenant draw the district grade alone would hide.
- Watch-outs: flood insurance adds $460/mo.
- Market conditions: 92 active listings in the ZIP; 1 comparable units currently listed for rent nearby; 91 units permitted in Chemung County in 2024 (63 in 5+ unit buildings).
- Chemung County population projected at -17% by 2050 — secular population decline; favor cash flow + early exit over multi-decade hold.
- At projected returns (-3.0% appreciation + 3.0% rent growth), your $10k cash investment doubles in ~10 years — after that, you're playing with house money.
- Climate carrying-cost: in FEMA flood zone AE (mandatory federal flood insurance) — expect insurance premiums to compound above CPI over the hold.
Questions for listing agent
- It's been on market 57 days. Have you received any prior offers? Is the seller open to a 3% concession, seller financing, or rate buy-down credit?
- What's the actual annual flood-insurance premium (NFIP or private), and is the property in a SFHA with mandatory coverage?
- Is there a deadline driving the sale (1031 exchange, divorce, estate, relocation)? That informs how much negotiation room exists.
- What's the average days-on-market for RENTAL listings here right now (not sales)? A rising rental-DOM trend means longer vacancies and softer asking-rent achievability than the comps imply.
- What's the recent tenant-quality profile in this submarket — average credit score on applications, eviction rate, late-payment / NSF rate, and stable-employment percentage? A property-management company in the area should have these aggregated.
- How much new for-sale + rental construction is in the pipeline within 1–3 miles? Heavy new supply typically softens prices + rents 12–24 months out; constrained supply supports both.
CashFlowRE · CFR-GNNTDM06FBZE5T
· Data 2 weeks ago
cashflowre.app · 2026-05-29