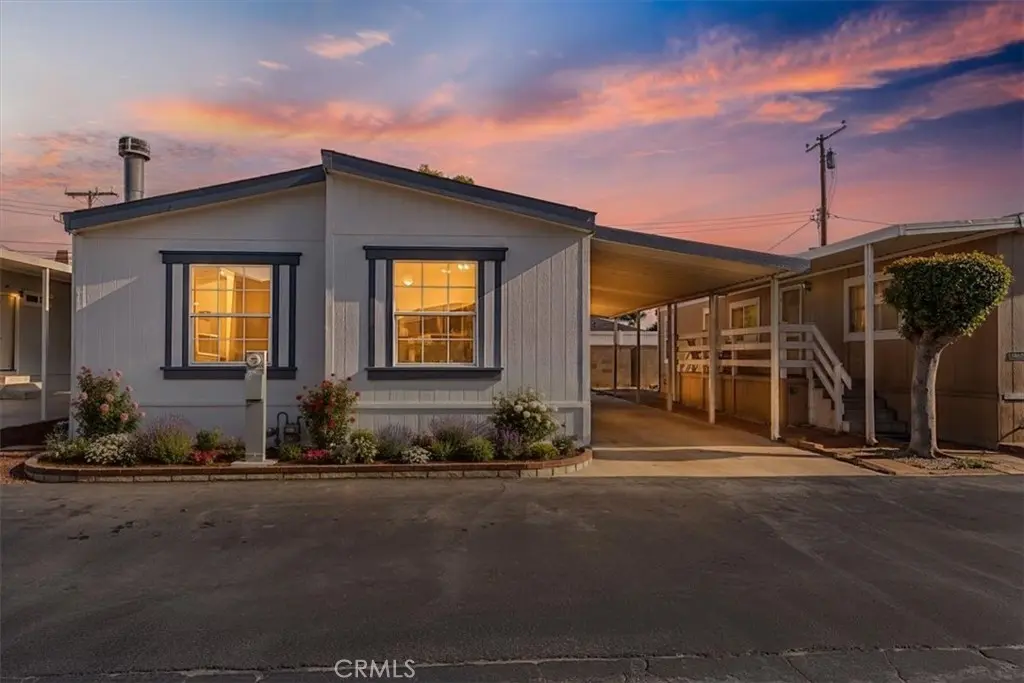
324 Magpie Ln #324
Fountain Valley, CA 92708
$225,000B-
3 bd · 2.0 ba ·
1,272 sqft ·
Built 1999
· Manufactured
· Active
· 5 DOM
Cashflow @ list (25.0% down · 7.5%)
Estimated rent
$4,159/mo
Mortgage (P&I)
−$1,180
Tax + insurance
−$375
HOA
−$0
Vac / Maint / Mgmt
−$873
Net cashflow
$1,731/mo
Annual
$20,771/yr
Cap rate
15.52%
Cash-on-cash
32.97%
DSCR
2.47
1% rule
1.85%
Cash to close
$63,000
Investor read
- This is a 3-bed/2.0-bath manufactured listed at $225k. Condition is rated good.
- At list price, monthly cash flow is $2k ($21k/yr) — positive.
- The deal already cash-flows at list — no discount required.
- Meets the 1% rule at list price ($4k rent vs $225k).
- Only 5 days on market — expect competitive offers; lowballing is unlikely to land.
- Local home prices are declining (-3.0%/yr); year-one equity from $2k of loan paydown is wiped out by about $7k of value loss. Plan a longer hold.
- Location reads 64/100 on livability (#403 in CA) — a middle-class / working-renter tenant base. Strengths: employment A+, crime B; Watch: commute F, cost of living F, health & safety F.
- Huntington Beach Union High (suburban): math 65% / reading 82% proficiency, ranked #39 of 517 in CA (top 8%) — strong family-tenant draw, lease renewals of 3-5y typical.
- Zoned schools: Fountain Valley High (math 80% / reading 94%, grade A, #21 of 1,170 statewide, top 2%, 3,180 students, 49% FRL).
- Zoned-school proficiency averages 87% at this address vs 74% district-wide (+14 pts) — the actual schools serving this property are materially stronger than the Huntington Beach Union High average implies; a family-tenant draw the district grade alone would hide.
- Market conditions: Rents rising (+3.1%/yr); 57 active listings in the ZIP; 27 comparable units currently listed for rent nearby; rentals leasing fast (median 2d on market — plan ~1-2 weeks tenant-placement turnaround); high-income renter base; 6,974 units permitted in Orange County in 2024 (3,839 in 5+ unit buildings).
- Orange County population projected at +14% by 2050 — modest demand growth; plan on rents tracking national, not racing it.
- At projected returns (-3.0% appreciation + 3.1% rent growth), your $63k cash investment doubles in ~4 years — after that, you're playing with house money.
- Climate carrying-cost: extreme-heat days projected 7→24/yr by 2055 (HVAC capex compounding) — expect insurance premiums to compound above CPI over the hold.
- Cap rate 15.5% vs local median 2.0% in Fountain Valley — top-decile yield for the area; either an underpriced asset or a hidden risk that comps aren't pricing in. Stress-test before assuming the spread holds.
- This rent runs 43% of the median local income ($115k/yr) — at the standard rent-burdened threshold; future hikes will face affordability resistance.
Questions for listing agent
- Is there a deadline driving the sale (1031 exchange, divorce, estate, relocation)? That informs how much negotiation room exists.
- Schools are A-rated — typically a magnet for longer-tenancy family renters. What's the average tenant stay here, and is there a school-zone premium baked into asking?
- What's the average days-on-market for RENTAL listings here right now (not sales)? A rising rental-DOM trend means longer vacancies and softer asking-rent achievability than the comps imply.
- What's the recent tenant-quality profile in this submarket — average credit score on applications, eviction rate, late-payment / NSF rate, and stable-employment percentage? A property-management company in the area should have these aggregated.
- How much new for-sale + rental construction is in the pipeline within 1–3 miles? Heavy new supply typically softens prices + rents 12–24 months out; constrained supply supports both.
CashFlowRE · CFR-GPJ7B3F8ZRSMCQ
· Data 2 days ago
cashflowre.app · 2026-05-29