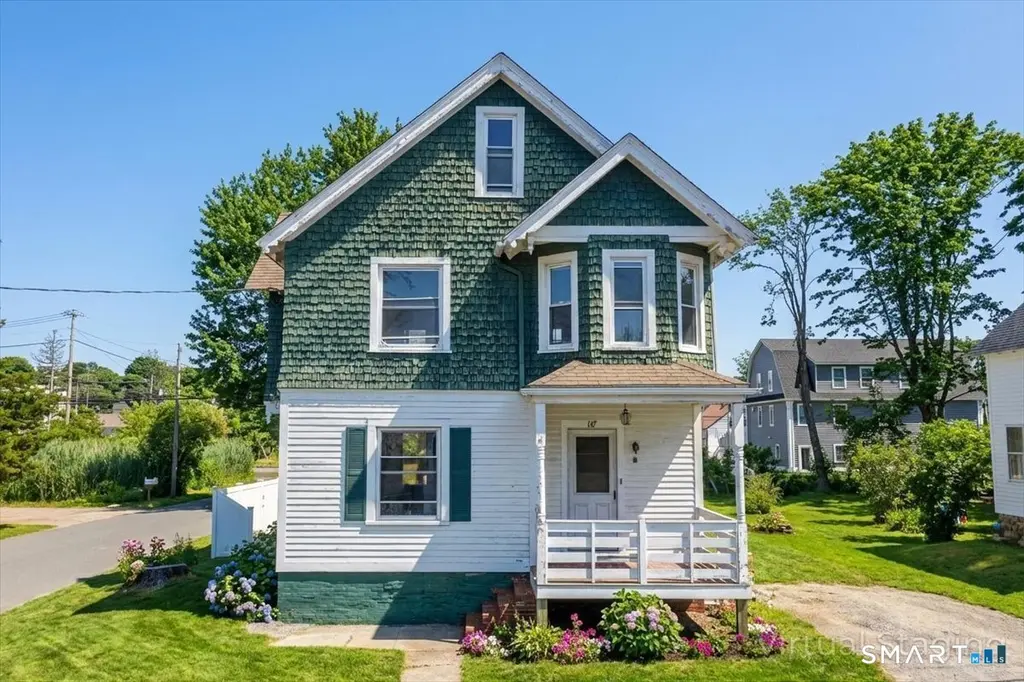
18 Maxson St
Mystic, CT 06355
$650,000D
4 bd · 2.0 ba ·
1,746 sqft ·
Built 1910
· SingleFamily
· Under Contract
· 70 DOM
Cashflow @ list (25.0% down · 7.5%)
Estimated rent
$5,010/mo
Mortgage (P&I)
−$3,409
Tax + insurance
−$852
HOA
−$0
Vac / Maint / Mgmt
−$1,052
Net cashflow
$-302/mo
Annual
$-3,629/yr
Cap rate
5.73%
Cash-on-cash
-1.99%
DSCR
0.91
1% rule
0.77%
Cash to close
$182,000
Investor read
- This is a 4-bed/2.0-bath single-family listed at $650k.
- At list price, monthly cash flow is $-302 ($-4k/yr) — negative.
- To cash-flow at today's rent, offer at most $597k (8.2% below list).
- To meet the 1% rule (rent ≥ 1% of price), the offer needs to be $501k (22.9% below list).
- It's been on market 70 days — a 6% lower offer ($611k) is reasonable based on typical stale-listing flexibility.
- Recommended offer: $501k (22.9% below list) — sets the bar for 1% rule.
- Local home prices are declining (-3.0%/yr); year-one equity from $4k of loan paydown is wiped out by about $20k of value loss. Plan a longer hold.
- Location reads 82/100 on livability (#11 in CT, #1,266 nationally) — a professional / high-income tenant draw. Strengths: crime A+, employment A+, housing A+; Watch: commute F, cost of living F.
- Groton School District (suburban): math 32% / reading 50% proficiency, ranked #96 of 153 in CT (top 63%) — families likely to look elsewhere, expect single-tenant / working-renter base with shorter leases.
- Watch-outs: built in 1910 — expect roof / HVAC / electrical / plumbing capex.
- Market conditions: 84 active listings in the ZIP; 8 comparable units currently listed for rent nearby; rentals lingering (median 44d on market — plan ~5-8 weeks vacancy on turnover, expect pricing pressure); 50% of comp listings sitting > 30 days — soft ceiling on asking rent; high-income renter base; 487 units permitted in Southeastern Connecticut Planning Region in 2024 (244 in 5+ unit buildings).
- 6 sale attempts since 14y ago with the ask held roughly flat each time — persistent listings suggest the price (not the market) is what's stuck; bring a comps-based counter.
- Current owner paid $405k; list at $650k implies a 60% gain — meaningful room to come down on a strong offer.
- Cap rate 5.7% vs local median 2.0% in Mystic — top-decile yield for the area; either an underpriced asset or a hidden risk that comps aren't pricing in. Stress-test before assuming the spread holds.
- This rent runs 44% of the median local income ($137k/yr) — at the standard rent-burdened threshold; future hikes will face affordability resistance.
Questions for listing agent
- What do current leases actually rent for vs. the listed asking? Can we see a recent rent roll and the last 12 months of T-12 income?
- It's been on market 70 days. Have you received any prior offers? Is the seller open to a 23% concession, seller financing, or rate buy-down credit?
- Built in 1910 — when were the roof, HVAC, electrical panel, plumbing, and water heater last replaced?
- Why hasn't it sold? Are there any deal-killer items the seller is aware of (foundation, flood, title, zoning, code violations)?
- Is there a deadline driving the sale (1031 exchange, divorce, estate, relocation)? That informs how much negotiation room exists.
- Schools are A-rated — typically a magnet for longer-tenancy family renters. What's the average tenant stay here, and is there a school-zone premium baked into asking?
- The area grade is low — what's the realistic commute time and amenity access for the typical tenant pool here? Any planned neighborhood developments (good or bad) we should know about?
- What's the average days-on-market for RENTAL listings here right now (not sales)? A rising rental-DOM trend means longer vacancies and softer asking-rent achievability than the comps imply.
CashFlowRE · CFR-GXJQF553VCNNQZ
· Data 3 weeks ago
cashflowre.app · 2026-05-29