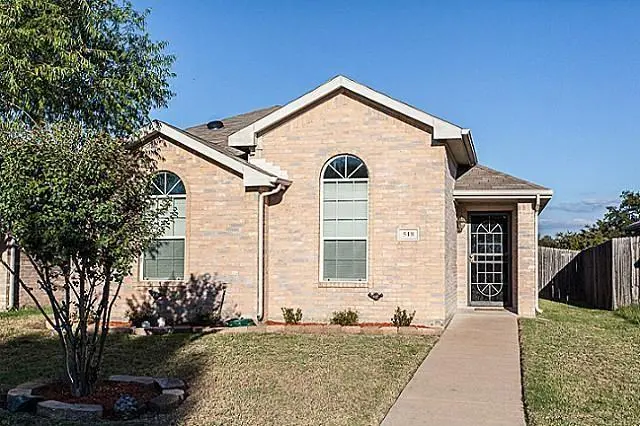
518 Monarch Dr
Lancaster, TX 75146
$249,000C-
3 bd · 2.5 ba ·
1,887 sqft ·
Built 2002
· MultiFamily
· Active
· 103 DOM
Cashflow @ list (25.0% down · 7.5%)
Estimated rent
$2,344/mo
Mortgage (P&I)
−$1,306
Tax + insurance
−$648
HOA
−$0
Vac / Maint / Mgmt
−$492
Net cashflow
$-101/mo
Annual
$-1,218/yr
Cap rate
5.80%
Cash-on-cash
-1.75%
DSCR
0.92
1% rule
0.94%
Cash to close
$69,720
Investor read
- This is a 3-bed/2.5-bath multifamily listed at $249k.
- At list price, monthly cash flow is $-101 ($-1k/yr) — negative.
- To cash-flow at today's rent, offer at most $231k (7.2% below list).
- To meet the 1% rule (rent ≥ 1% of price), the offer needs to be $234k (5.9% below list).
- It's been on market 103 days — a 9% lower offer ($227k) is reasonable based on typical stale-listing flexibility.
- Recommended offer: $227k (9.0% below list) — sets the bar for market timing.
- In year one you build about $11k of equity ($2k loan paydown + $9k appreciation (3.6% local appreciation)).
- Location reads 62/100 on livability (#926 in TX) — a middle-class / working-renter tenant base. Strengths: cost of living A+, housing A+; Watch: employment C-, schools D, crime F.
- Lancaster ISD (suburban): math 19% / reading 29% proficiency, ranked #714 of 826 in TX (top 86%) — low school quality limits family demand, transient renter base, plan for 1-2y turnover; 78% free/reduced lunch — lower-income household profile, screen leases tightly.
- Watch-outs: property tax is 2.6% of price.
- Market conditions: Rents rising (+3.0%/yr); 103 active listings in the ZIP; 40 comparable units currently listed for rent nearby; rentals at typical pace (median 21d on market — plan ~3-4 weeks tenant-placement turnaround); 12,577 units permitted in Dallas County in 2024 (6,829 in 5+ unit buildings).
- Dallas County population projected at +35% by 2050 — long-run rental-demand tailwind backs the buy-and-hold thesis.
- 3 sale attempts since 13y ago; this cycle's ask has dropped $21k (8%) from the opening price — seller is motivated, your offer sets the floor, not the list.
- By year 4, paydown + projected appreciation supports a ~$36k cash-out refi (75% LTV) — recoverable capital for the next deal without selling this one.
- Climate carrying-cost: major wind risk, 27% chance of damaging wind over 30y; extreme-heat days projected 7→24/yr by 2055 (HVAC capex compounding) — expect insurance premiums to compound above CPI over the hold.
- Cap rate 5.8% vs local median 4.8% in Lancaster — meaningfully above typical; check what's discounted (condition, days-on-market, listing class) to confirm the premium yield is real.
- This rent runs 41% of the median local income ($68k/yr) — at the standard rent-burdened threshold; future hikes will face affordability resistance.
Questions for listing agent
- What do current leases actually rent for vs. the listed asking? Can we see a recent rent roll and the last 12 months of T-12 income?
- It's been on market 103 days. Have you received any prior offers? Is the seller open to a 9% concession, seller financing, or rate buy-down credit?
- Property tax is high relative to price — has the assessment been appealed recently, and will the sale trigger a re-assessment?
- Why hasn't it sold? Are there any deal-killer items the seller is aware of (foundation, flood, title, zoning, code violations)?
- Is there a deadline driving the sale (1031 exchange, divorce, estate, relocation)? That informs how much negotiation room exists.
- Schools are D-rated, which usually means shorter tenancies and higher turnover. Who's the typical renter profile here, and what's been the actual vacancy rate?
- Crime grade is F in this area — have there been break-ins, vandalism, or insurance claims at this property in the last 3 years? What carrier currently insures it and at what premium?
- What's the average days-on-market for RENTAL listings here right now (not sales)? A rising rental-DOM trend means longer vacancies and softer asking-rent achievability than the comps imply.
CashFlowRE · CFR-H1CWAZARMVMZMW
· Data 2 days ago
cashflowre.app · 2026-05-29