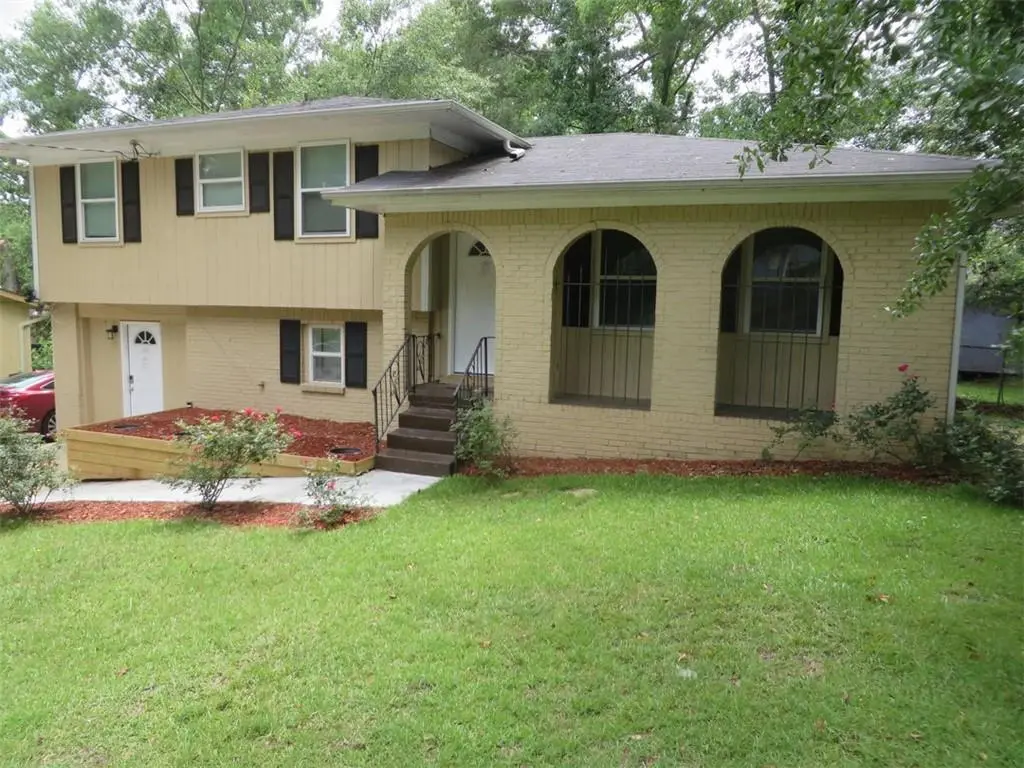
3755 Cedar Hurst Way
South Fulton, GA 30349
$283,500D-
5 bd · 4.0 ba ·
1,201 sqft ·
Built 1972
· SingleFamily
· Active
· 139 DOM
Cashflow @ list (25.0% down · 7.5%)
Estimated rent
$2,198/mo
Mortgage (P&I)
−$1,487
Tax + insurance
−$360
HOA
−$0
Vac / Maint / Mgmt
−$462
Net cashflow
$-110/mo
Annual
$-1,324/yr
Cap rate
5.83%
Cash-on-cash
-1.67%
DSCR
0.93
1% rule
0.78%
Cash to close
$79,380
Investor read
- This is a 5-bed/4.0-bath single-family listed at $284k.
- At list price, monthly cash flow is $-110 ($-1k/yr) — negative.
- To cash-flow at today's rent, offer at most $264k (6.9% below list).
- To meet the 1% rule (rent ≥ 1% of price), the offer needs to be $220k (22.5% below list).
- It's been on market 139 days — a 12% lower offer ($249k) is reasonable based on typical stale-listing flexibility.
- Recommended offer: $220k (22.5% below list) — sets the bar for 1% rule.
- In year one you build about $30k of equity ($2k loan paydown + $28k appreciation (10.0% local appreciation)).
- Location reads: area grade D — affects rentability + tenant quality, not the cash-flow math above.
- Fulton County (suburban): math 49% / reading 53% proficiency, ranked #12 of 174 in GA (top 7%) — acceptable for families but not a draw, mixed tenant base, ~2y average lease.
- Market conditions: Rents flat; 651 active listings in the ZIP; 5 comparable units currently listed for rent nearby; rentals at typical pace (median 25d on market — plan ~3-4 weeks tenant-placement turnaround); 11,565 units permitted in Fulton County in 2024 (8,159 in 5+ unit buildings).
- Fulton County population projected at +38% by 2050 — long-run rental-demand tailwind backs the buy-and-hold thesis.
- 9 sale attempts since 15y ago; this cycle's ask is 3% above the opening price — seller raised mid-cycle; expect resistance to lowballs.
- Current owner paid $124k; list at $284k implies a 129% gain — meaningful room to come down on a strong offer.
- By year 2, paydown + projected appreciation supports a ~$49k cash-out refi (75% LTV) — recoverable capital for the next deal without selling this one.
- Climate carrying-cost: major wind risk, 27% chance of damaging wind over 30y; extreme-heat days projected 7→18/yr by 2055 (HVAC capex compounding) — expect insurance premiums to compound above CPI over the hold.
- Cap rate 5.8% vs local median 4.6% in South Fulton — meaningfully above typical; check what's discounted (condition, days-on-market, listing class) to confirm the premium yield is real.
- This rent runs 39% of the median local income ($67k/yr) — at the standard rent-burdened threshold; future hikes will face affordability resistance.
Questions for listing agent
- What do current leases actually rent for vs. the listed asking? Can we see a recent rent roll and the last 12 months of T-12 income?
- It's been on market 139 days. Have you received any prior offers? Is the seller open to a 22% concession, seller financing, or rate buy-down credit?
- Built in 1972 — when were the roof, HVAC, electrical panel, plumbing, and water heater last replaced?
- Why hasn't it sold? Are there any deal-killer items the seller is aware of (foundation, flood, title, zoning, code violations)?
- Is there a deadline driving the sale (1031 exchange, divorce, estate, relocation)? That informs how much negotiation room exists.
- The area grade is low — what's the realistic commute time and amenity access for the typical tenant pool here? Any planned neighborhood developments (good or bad) we should know about?
- What's the average days-on-market for RENTAL listings here right now (not sales)? A rising rental-DOM trend means longer vacancies and softer asking-rent achievability than the comps imply.
- What's the recent tenant-quality profile in this submarket — average credit score on applications, eviction rate, late-payment / NSF rate, and stable-employment percentage? A property-management company in the area should have these aggregated.
CashFlowRE · CFR-H1TAEFCRTCWA7R
· Data 2 days ago
cashflowre.app · 2026-05-29