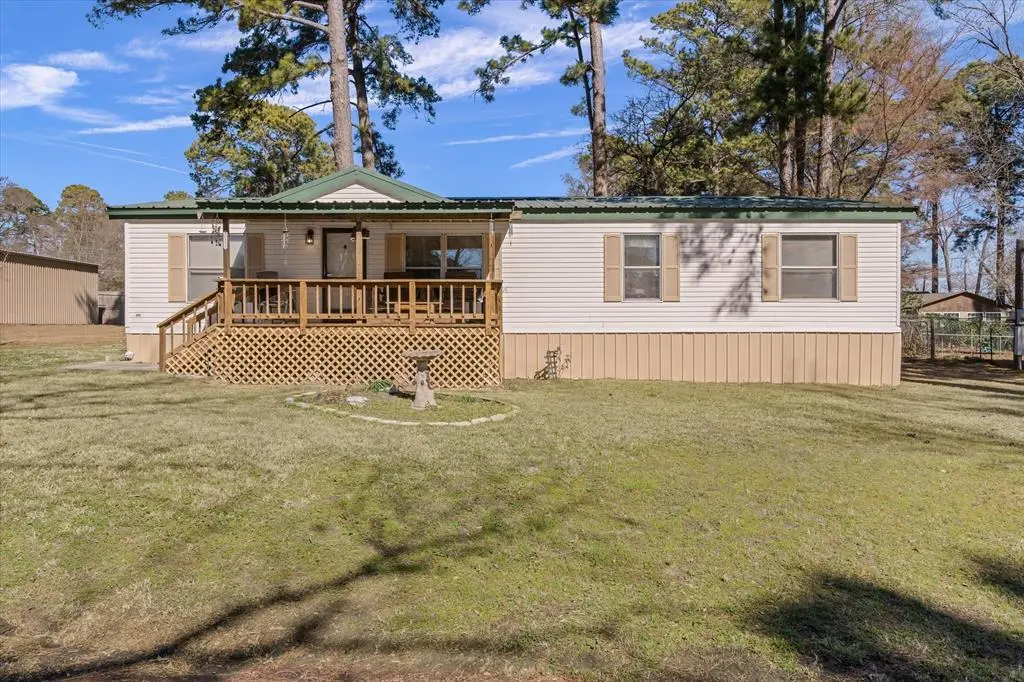
20711 Kingsley Dr
Sunrise Shores, TX 75758
$120,000C+
3 bd · 2.0 ba ·
1,404 sqft ·
Built 1998
· SingleFamily
· Active
· 9 DOM
Cashflow @ list (25.0% down · 7.5%)
Estimated rent
$1,505/mo
Mortgage (P&I)
−$629
Tax + insurance
−$200
HOA
−$8
Vac / Maint / Mgmt
−$316
Net cashflow
$352/mo
Annual
$4,221/yr
Cap rate
9.81%
Cash-on-cash
12.56%
DSCR
1.56
1% rule
1.25%
Cash to close
$33,600
Investor read
- This is a 3-bed/2.0-bath single-family listed at $120k. Condition is rated good.
- At list price, monthly cash flow is $352 ($4k/yr) — positive.
- The deal already cash-flows at list — no discount required.
- Meets the 1% rule at list price ($2k rent vs $120k).
- Only 9 days on market — expect competitive offers; lowballing is unlikely to land.
- Local home prices are declining (-3.0%/yr); year-one equity from $830 of loan paydown is wiped out by about $4k of value loss. Plan a longer hold.
- Location reads: area grade C — affects rentability + tenant quality, not the cash-flow math above.
- Brownsboro ISD (rural): math 42% / reading 46% proficiency, ranked #290 of 826 in TX (top 35%) — families likely to look elsewhere, expect single-tenant / working-renter base with shorter leases.
- Zoned schools: Chandler El (math 42% / reading 37%, grade F, #1,545 of 4,322 statewide, top 38%, 450 students, 74% FRL) — zoned schools average 74% FRL vs 51% district-wide (24 pts higher); higher-poverty schools than district average — tighter screening recommended.
- Market conditions: 228 active listings in the ZIP; 263 units permitted in Henderson County in 2024 (0 in 5+ unit buildings).
- 3 sale attempts with the ask held roughly flat each time — persistent listings suggest the price (not the market) is what's stuck; bring a comps-based counter.
- At projected returns (-3.0% appreciation + 3.0% rent growth), your $34k cash investment doubles in ~9 years — after that, you're playing with house money.
- Climate carrying-cost: major wind risk, 67% chance of damaging wind over 30y; extreme-heat days projected 7→26/yr by 2055 (HVAC capex compounding) — expect insurance premiums to compound above CPI over the hold.
- Cap rate 9.8% vs local median 4.1% in Sunrise Shores — top-decile yield for the area; either an underpriced asset or a hidden risk that comps aren't pricing in. Stress-test before assuming the spread holds.
Questions for listing agent
- What does the HOA fee cover, when was the last increase, and are there any pending special assessments or reserve-fund shortfalls?
- Is there a deadline driving the sale (1031 exchange, divorce, estate, relocation)? That informs how much negotiation room exists.
- What's the average days-on-market for RENTAL listings here right now (not sales)? A rising rental-DOM trend means longer vacancies and softer asking-rent achievability than the comps imply.
- What's the recent tenant-quality profile in this submarket — average credit score on applications, eviction rate, late-payment / NSF rate, and stable-employment percentage? A property-management company in the area should have these aggregated.
- How much new for-sale + rental construction is in the pipeline within 1–3 miles? Heavy new supply typically softens prices + rents 12–24 months out; constrained supply supports both.
CashFlowRE · CFR-H32GTN850DEW0T
· Data 5 h ago
cashflowre.app · 2026-05-29