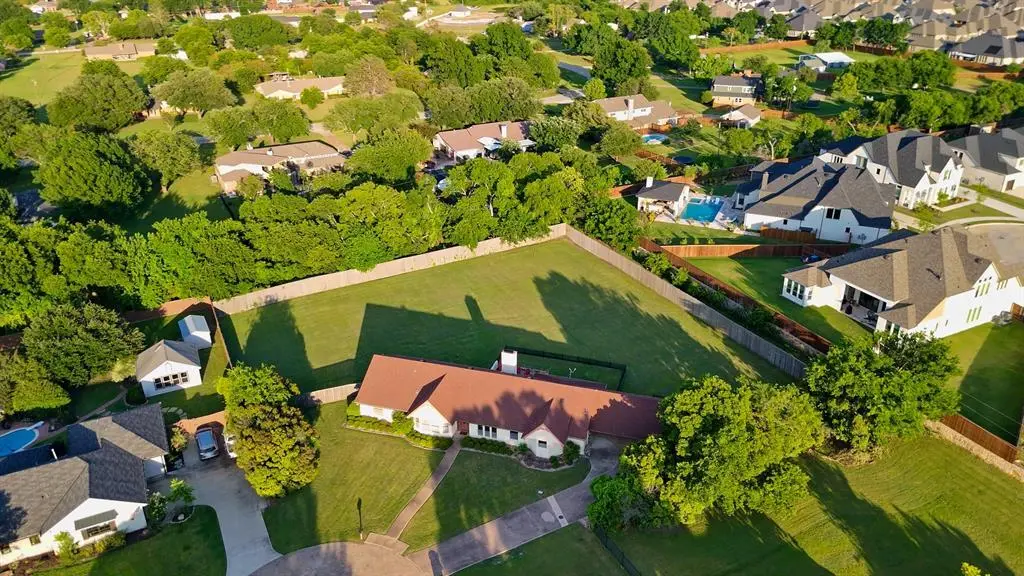
10 Park Central Cir
Rockwall, TX 75087
$385,000D
4 bd · 2.0 ba ·
1,899 sqft ·
Built 1983
· SingleFamily
· Pending
· 7 DOM
Cashflow @ list (25.0% down · 7.5%)
Estimated rent
$2,788/mo
Mortgage (P&I)
−$2,019
Tax + insurance
−$454
HOA
−$4
Vac / Maint / Mgmt
−$585
Net cashflow
$-274/mo
Annual
$-3,294/yr
Cap rate
5.44%
Cash-on-cash
-3.06%
DSCR
0.86
1% rule
0.72%
Cash to close
$107,800
Investor read
- This is a 4-bed/2.0-bath single-family listed at $385k.
- At list price, monthly cash flow is $-274 ($-3k/yr) — negative.
- To cash-flow at today's rent, offer at most $337k (12.6% below list).
- To meet the 1% rule (rent ≥ 1% of price), the offer needs to be $279k (27.6% below list).
- Only 7 days on market — expect competitive offers; lowballing is unlikely to land.
- Recommended offer: $279k (27.6% below list) — sets the bar for 1% rule.
- Local home prices are declining (-3.0%/yr); year-one equity from $3k of loan paydown is wiped out by about $12k of value loss. Plan a longer hold.
- Location reads 77/100 on livability (#86 in TX, #3,043 nationally) — a middle-class / working-renter tenant base. Strengths: employment A+, housing A+, crime A-; Watch: amenities F, commute F.
- Rockwall ISD (suburban): math 54% / reading 54% proficiency, ranked #83 of 826 in TX (top 10%) — acceptable for families but not a draw, mixed tenant base, ~2y average lease.
- Zoned schools: Celia Hays El (math 62% / reading 59%, grade B-, #385 of 4,322 statewide, top 9%, 517 students, 11% FRL); J W Williams Middle (math 51% / reading 55%, grade C+, #281 of 1,662 statewide, top 18%, 828 students, 21% FRL); Rockwall-Heath H S (math 50% / reading 61%, grade C, #364 of 1,632 statewide, top 23%, 2,912 students, 28% FRL) — zoned schools at 20% FRL track the district average.
- Market conditions: Rents rising (+3.2%/yr); 1016 active listings in the ZIP; 2 comparable units currently listed for rent nearby; high-income renter base; 1,810 units permitted in Rockwall County in 2024 (0 in 5+ unit buildings).
- Rockwall County population projected at +56% by 2050 — long-run rental-demand tailwind backs the buy-and-hold thesis.
- Climate carrying-cost: major wind risk, 27% chance of damaging wind over 30y; moderate wildfire risk; extreme-heat days projected 7→24/yr by 2055 (HVAC capex compounding) — expect insurance premiums to compound above CPI over the hold.
- Cap rate 5.4% vs local median 2.9% in Rockwall — top-decile yield for the area; either an underpriced asset or a hidden risk that comps aren't pricing in. Stress-test before assuming the spread holds.
Questions for listing agent
- What do current leases actually rent for vs. the listed asking? Can we see a recent rent roll and the last 12 months of T-12 income?
- What does the HOA fee cover, when was the last increase, and are there any pending special assessments or reserve-fund shortfalls?
- Is there a deadline driving the sale (1031 exchange, divorce, estate, relocation)? That informs how much negotiation room exists.
- Schools are B-rated — typically a magnet for longer-tenancy family renters. What's the average tenant stay here, and is there a school-zone premium baked into asking?
- The area grade is low — what's the realistic commute time and amenity access for the typical tenant pool here? Any planned neighborhood developments (good or bad) we should know about?
- What's the average days-on-market for RENTAL listings here right now (not sales)? A rising rental-DOM trend means longer vacancies and softer asking-rent achievability than the comps imply.
- What's the recent tenant-quality profile in this submarket — average credit score on applications, eviction rate, late-payment / NSF rate, and stable-employment percentage? A property-management company in the area should have these aggregated.
- How much new for-sale + rental construction is in the pipeline within 1–3 miles? Heavy new supply typically softens prices + rents 12–24 months out; constrained supply supports both.
CashFlowRE · CFR-H3GCG47W4KS21A
· Data 4 weeks ago
cashflowre.app · 2026-05-29