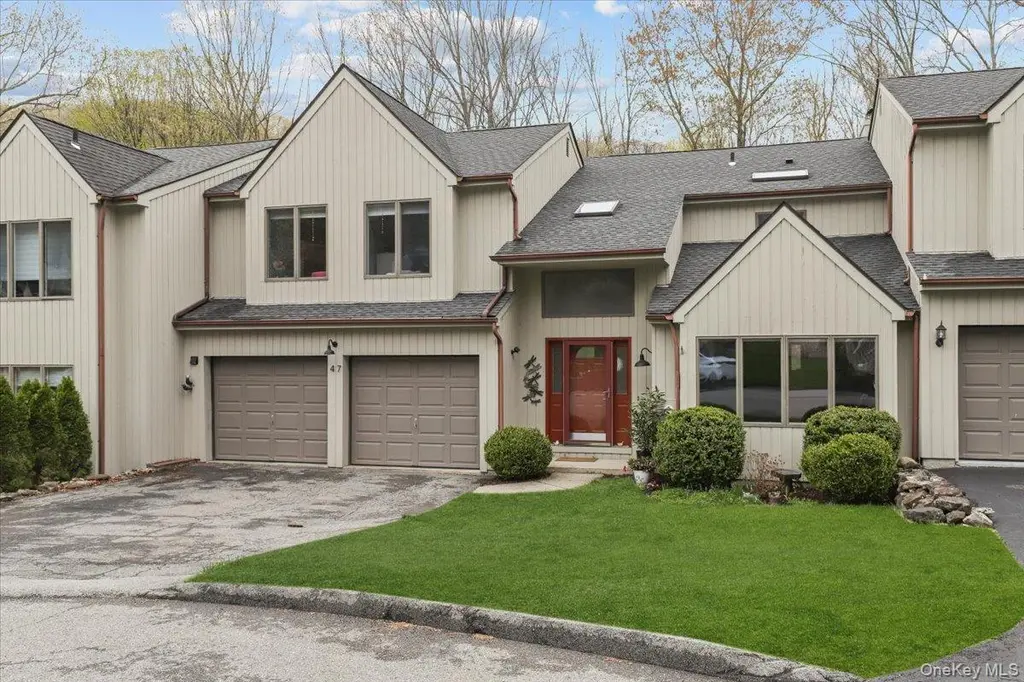
47 Driftwood
Heritage Hills, NY 10589
$795,000D
3 bd · 2.0 ba ·
2,635 sqft ·
Built 1998
· Townhouse
· Pending
· 26 DOM
Cashflow @ list (25.0% down · 7.5%)
Estimated rent
$6,900/mo
Mortgage (P&I)
−$4,169
Tax + insurance
−$1,652
HOA
−$400
Vac / Maint / Mgmt
−$1,449
Net cashflow
$-770/mo
Annual
$-9,240/yr
Cap rate
5.13%
Cash-on-cash
-4.15%
DSCR
0.82
1% rule
0.87%
Cash to close
$222,600
Investor read
- This is a 3-bed/2.0-bath townhouse listed at $795k.
- At list price, monthly cash flow is $-770 ($-9k/yr) — negative.
- To cash-flow at today's rent, offer at most $659k (17.1% below list).
- To meet the 1% rule (rent ≥ 1% of price), the offer needs to be $690k (13.2% below list).
- It's been on market 26 days — a 2% lower offer ($783k) is reasonable based on typical stale-listing flexibility.
- Recommended offer: $659k (17.1% below list) — sets the bar for cash-flow.
- Local home prices are declining (-3.0%/yr); year-one equity from $5k of loan paydown is wiped out by about $24k of value loss. Plan a longer hold.
- Location reads 64/100 on livability (#757 in NY) — a middle-class / working-renter tenant base. Strengths: crime A+, employment A+, housing B; Watch: amenities F, commute F, cost of living F.
- North Salem Central School District (rural): math 57% / reading 74% proficiency, ranked #125 of 590 in NY (top 21%) — acceptable for families but not a draw, mixed tenant base, ~2y average lease; only 6% free/reduced lunch — higher-income household profile.
- Zoned schools: Pequenakonck Elementary School (math 47% / reading 72%, grade B-, #745 of 2,108 statewide, top 39%, 438 students, 16% FRL); North Salem Middle School/High School (math 67% / reading 78%, grade B+, #671 of 1,100 statewide, top 61%, 547 students, 20% FRL).
- Market conditions: 89 active listings in the ZIP; 1 comparable units currently listed for rent nearby; 954 units permitted in Westchester County in 2024 (649 in 5+ unit buildings).
- Westchester County population projected at +10% by 2050 — modest demand growth; plan on rents tracking national, not racing it.
- 5 sale attempts since 18y ago with the ask held roughly flat each time — persistent listings suggest the price (not the market) is what's stuck; bring a comps-based counter.
- Current owner paid $580k; 37% above their basis — modest negotiation headroom, anchor on the comps not their cost.
- Climate carrying-cost: extreme-heat days projected 7→15/yr by 2055 (HVAC capex compounding) — expect insurance premiums to compound above CPI over the hold.
- Cap rate 5.1% vs local median 2.5% in Heritage Hills — top-decile yield for the area; either an underpriced asset or a hidden risk that comps aren't pricing in. Stress-test before assuming the spread holds.
Questions for listing agent
- What do current leases actually rent for vs. the listed asking? Can we see a recent rent roll and the last 12 months of T-12 income?
- What does the HOA fee cover, when was the last increase, and are there any pending special assessments or reserve-fund shortfalls?
- Is there a deadline driving the sale (1031 exchange, divorce, estate, relocation)? That informs how much negotiation room exists.
- The area grade is low — what's the realistic commute time and amenity access for the typical tenant pool here? Any planned neighborhood developments (good or bad) we should know about?
- What's the average days-on-market for RENTAL listings here right now (not sales)? A rising rental-DOM trend means longer vacancies and softer asking-rent achievability than the comps imply.
- What's the recent tenant-quality profile in this submarket — average credit score on applications, eviction rate, late-payment / NSF rate, and stable-employment percentage? A property-management company in the area should have these aggregated.
- How much new for-sale + rental construction is in the pipeline within 1–3 miles? Heavy new supply typically softens prices + rents 12–24 months out; constrained supply supports both.
CashFlowRE · CFR-H49MN46RY88DPZ
· Data 4 days ago
cashflowre.app · 2026-05-29