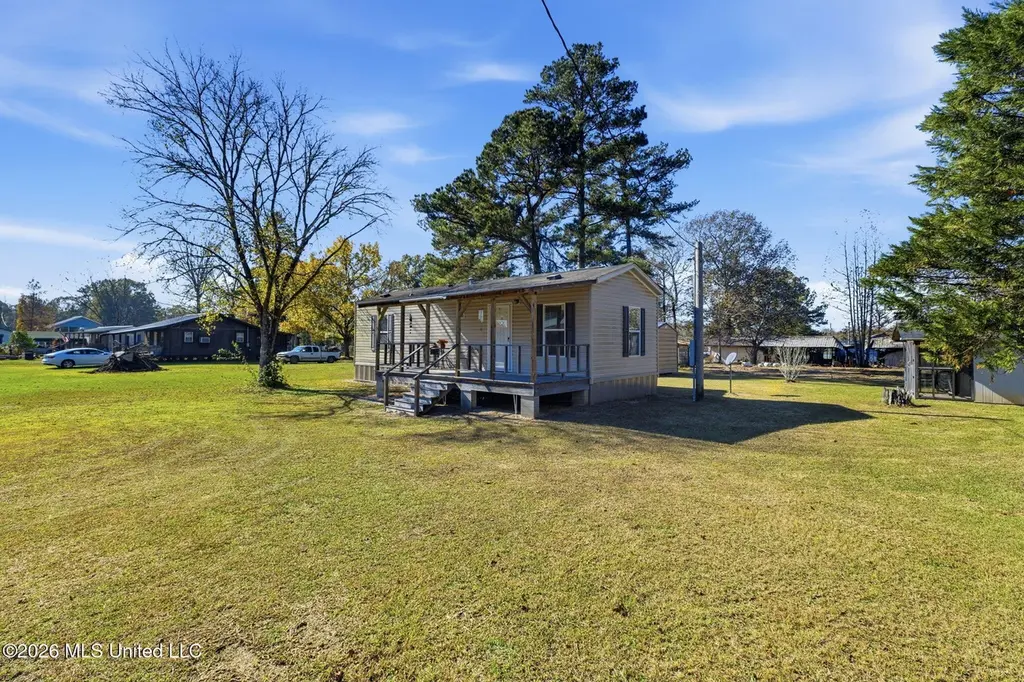
435 Mississippi 43 Lot 94
Angie, LA 39429
$58,000B-
1 bd · 1.0 ba ·
550 sqft ·
Built 2015
· Manufactured
· Pending
· 25 DOM
Cashflow @ list (25.0% down · 7.5%)
Estimated rent
$756/mo
Mortgage (P&I)
−$304
Tax + insurance
−$97
HOA
−$0
Vac / Maint / Mgmt
−$159
Net cashflow
$197/mo
Annual
$2,360/yr
Cap rate
10.36%
Cash-on-cash
14.53%
DSCR
1.65
1% rule
1.30%
Cash to close
$16,240
Investor read
- This is a 1-bed/1.0-bath manufactured listed at $58k.
- At list price, monthly cash flow is $197 ($2k/yr) — positive.
- The deal already cash-flows at list — no discount required.
- Meets the 1% rule at list price ($756 rent vs $58k).
- It's been on market 25 days — a 2% lower offer ($57k) is reasonable based on typical stale-listing flexibility.
- Recommended offer: $57k (1.5% below list) — sets the bar for market timing.
- Local home prices are declining (-3.0%/yr); year-one equity from $401 of loan paydown is wiped out by about $2k of value loss. Plan a longer hold.
- Location reads 60/100 on livability (#254 in LA) — a middle-class / working-renter tenant base. Strengths: cost of living A+, housing A+; Watch: employment C-, health & safety D, crime F.
- Marion County School District (rural): math 37% / reading 29% proficiency, ranked #62 of 130 in MS (top 48%) — families likely to look elsewhere, expect single-tenant / working-renter base with shorter leases; 79% free/reduced lunch — lower-income household profile, screen leases tightly.
- Zoned schools: East Marion Elementary School (math 20% / reading 18%, grade F, #251 of 375 statewide, top 67%, 394 students, 100% FRL); West Marion Elementary (math 43% / reading 38%, grade F, #60 of 179 statewide, top 37%, 259 students, 100% FRL); East Marion High School (math 27% / reading 17%, grade F, #119 of 197 statewide, top 64%, 330 students, 100% FRL) — zoned schools average 100% FRL vs 79% district-wide (21 pts higher); higher-poverty schools than district average — tighter screening recommended.
- Market conditions: 2 units permitted in Marion County in 2024 (0 in 5+ unit buildings).
- Marion County population projected at -33% by 2050 — secular population decline; favor cash flow + early exit over multi-decade hold.
- 3 sale attempts; this cycle's ask has dropped $21k (26%) from the opening price — seller is motivated, your offer sets the floor, not the list.
- At projected returns (-3.0% appreciation + 3.0% rent growth), your $16k cash investment doubles in ~9 years — after that, you're playing with house money.
- Climate carrying-cost: extreme-heat days projected 7→20/yr by 2055 (HVAC capex compounding) — expect insurance premiums to compound above CPI over the hold.
Questions for listing agent
- Is there a deadline driving the sale (1031 exchange, divorce, estate, relocation)? That informs how much negotiation room exists.
- Crime grade is F in this area — have there been break-ins, vandalism, or insurance claims at this property in the last 3 years? What carrier currently insures it and at what premium?
- What's the average days-on-market for RENTAL listings here right now (not sales)? A rising rental-DOM trend means longer vacancies and softer asking-rent achievability than the comps imply.
- What's the recent tenant-quality profile in this submarket — average credit score on applications, eviction rate, late-payment / NSF rate, and stable-employment percentage? A property-management company in the area should have these aggregated.
- How much new for-sale + rental construction is in the pipeline within 1–3 miles? Heavy new supply typically softens prices + rents 12–24 months out; constrained supply supports both.
CashFlowRE · CFR-H5EQGW61AZD2E0
· Data 1 week ago
cashflowre.app · 2026-05-29